<b>ANSOS2Go</b> allows employees to view their ANSOS Staff Scheduling calendars with ease.
<b>*** IMPORTANT: After installing ANSOS2Go you must contact your organization’s IT department for the necessary website URL as well as your username and password. If you have trouble logging in or connecting to a server please contact your organization’s IT department. ***</b>
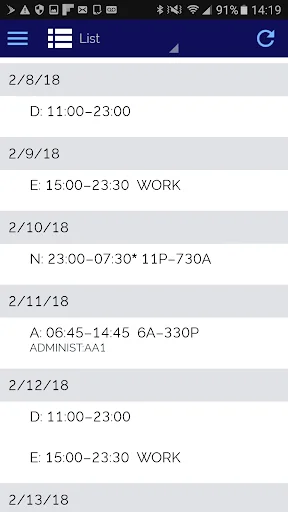
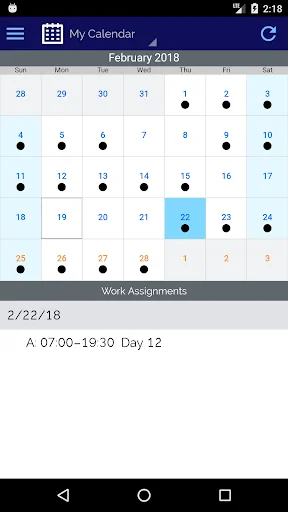
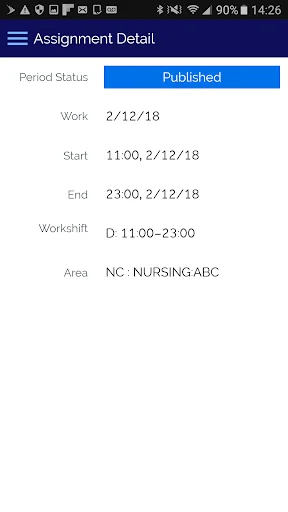
With ANSOS2Go, employees can view their calendars to quickly see days containing work assignments and tap a day to view t…
ANSOS2Go allows employees to view their ANSOS Staff Scheduling calendars with ease.
*** IMPORTANT: After installing ANSOS2Go you must contact your organization’s IT department for the necessary website URL as well as your username and password. If you have trouble logging in or connecting to a server please contact your organization’s IT department. ***
With ANSOS2Go, employees can view their calendars to quickly see days containing work assignments and tap a day to view the start and end time, workshift, and area of any assignment. Employees can see what Area, date, time and shift they are working at a glance, on-the-Go!
With the expanded use of Web Scheduler, employees can also request work, time off and select available shifts - all in 3 clicks to a shift.
Plus managers and employees with security access can view Area Schedules and can call, email or text an employee just by tapping the employee’s name.
All of these features are backed by an array of security protections against unwarranted access to personal information.
ANSOS2Go is supported with the latest release of ANSOS Staff Scheduling as well as the previous major release.
Comparable Android apps
The five apps in Productivity with the closest revenue to ANSOS2Go. Click any to see its detail page.
Each forecast combines App Store rating, ratings count, monetisation model, pricing tier, IAP signals and ad-supported flag.
The base estimate is then multiplied by a per-category scaling factor learned from apps with founder-verified MRR.
Every number on this page comes from public APIs and bumetric's own snapshot history.
Full methodology covers input variables, accuracy bands per category and how we treat apps without comparable anchors.
See also the live data on ANSOS2Go's tracker page for current rating, reviews and snapshot timeline.
Building something similar? Get a free AI audit with $-revenue forecasts for every recommendation.

 FarmENGAGE
 NextGIS Mobile
 Active Directory Manager Lite
 BIM-Express
 Brevity Care Software