What ANZ Pacific actually does (from store listing)
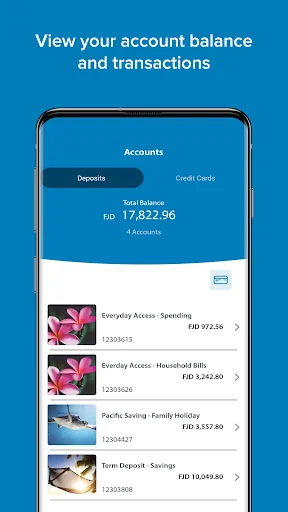
ANZ Pacific App is our secure mobile banking app that puts your money at your fingertips. It’s now available for both personal and business customers, and you can use it anywhere – on the bus, at the beach, at home or in the office.
Manage your everyday banking
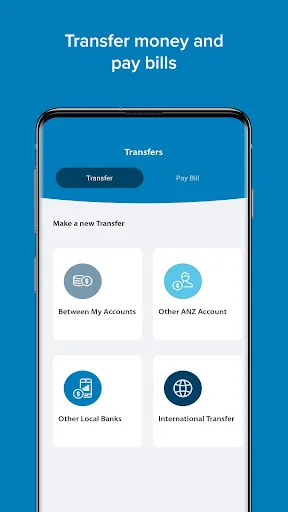
• Move money between your accounts
• Send money to anyone with an ANZ bank account
• Send money to anyone in another local bank
• Send money overseas
• Pay bills from a list of ANZ registered billers
• Set up and manage schedule…
ANZ Pacific App is our secure mobile banking app that puts your money at your fingertips. It’s now available for both personal and business customers, and you can use it anywhere – on the bus, at the beach, at home or in the office.
Manage your everyday banking
• Move money between your accounts
• Send money to anyone with an ANZ bank account
• Send money to anyone in another local bank
• Send money overseas
• Pay bills from a list of ANZ registered billers
• Set up and manage scheduled payments
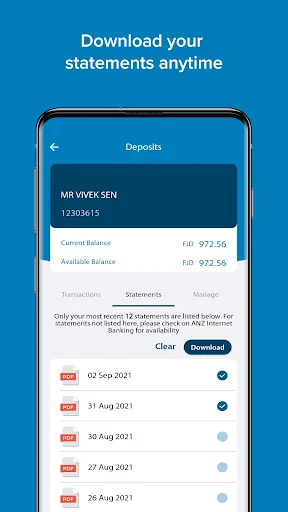
• View and download your account statements in PDF format
• Update your contact details
• Send a secure Bank Mail to ANZ
Manage your business
• Access your Personal and Business profiles on one device
• Send money to anyone in locally or overseas
• Approve transactions submitted for authorisation
• Set up and manage scheduled payments
• View and download your account statements in PDF format
• Send a secure Bank Mail to ANZ
Your money and personal details are protected because:
• ANZ Pacific App is guarded by high-grade encryption and we ensure none of your personal or banking details are stored on your device.
• Security Questions provides a second level of authentication for registration.
• ANZ Pacific App locks you out if you repeatedly use the wrong security PIN, Security Questions or password, and will time-out if the app is left running for too long with no activity.
How to get set up:
Getting the ANZ Pacific App is easy. To get it, you’ll need to be registered for ANZ Internet Banking first.
You will also need an Android phone or tablet running Android operating system version 8.1 (or above).
To use the ANZ Pacific App, you must have a valid ANZ Internet Banking User ID and Password.
• Open the ANZ Pacific App and select your country
• Enter your User ID and Password (please ensure you read, understand and accept the Terms and Conditions)
• Set up a new 4-digit PIN and re-enter it to confirm
• Once you've entered your PIN you'll need to complete the two security questions, when successful, you will be able to access the ANZ Pacific App.
Important information
The ANZ Pacific App is provided by the branch of Australia and New Zealand Banking Group Limited ABN 11 005 357 operating in the jurisdiction where your account(s) is opened and held.
By installing the ANZ Pacific App you acknowledge and accept the ANZ Pacific App Terms and Conditions and agree to receive those terms and conditions and any amendments to them electronically via your mobile device. You acknowledge that ANZ will not send you a paper copy, but you can get a copy below:
Cook Islands: https://www.anz.com/cookislands/en/personal/ways-bank/anz-pacific-app/
Fiji: https://www.anz.com/fiji/en/personal/ways-bank/anz-pacific-app/
Kiribati: https://www.anz.com/kiribati/en/personal/ways-bank/anz-pacific-app/
Samoa: https://www.anz.com/samoa/en/personal/ways-bank/anz-pacific-app/
Solomon Islands: https://www.anz.com/solomonislands/en/personal/ways-bank/anz-pacific-app/
Tonga: https://www.anz.com/tonga/en/personal/ways-bank/anz-pacific-app/
Vanuatu: https://www.anz.com/vanuatu/en/personal/ways-bank/anz-pacific-app/
Comparable Android apps
The five apps in Finance with the closest revenue to ANZ Pacific. Click any to see its detail page.
Each forecast combines App Store rating, ratings count, monetisation model, pricing tier, IAP signals and ad-supported flag.
The base estimate is then multiplied by a per-category scaling factor learned from apps with founder-verified MRR.
Every number on this page comes from public APIs and bumetric's own snapshot history.
Full methodology covers input variables, accuracy bands per category and how we treat apps without comparable anchors.
See also the live data on ANZ Pacific's tracker page for current rating, reviews and snapshot timeline.
Building something similar? Get a free AI audit with $-revenue forecasts for every recommendation.



 BCVS TWINT
 RadiFi Mobile Banking
 Empay
Empay
 Negativado Empréstimo Pessoal
 XOH Trader