What Chart Maker: Graphs and charts actually does (from store listing)
App to create graphs and charts. Easily create beautiful graphs and charts on your smartphone or tablet. The Chart Maker app has many different graphs to display your data. You can create both regular charts and pie charts. Simply select the appropriate schedule and add data to it. All created graphs and charts will be stored in the application. You can always edit a saved graph or chart, add data to it, or delete it.
Creating graphs and charts is incredibly easy!
The application has the mos…
App to create graphs and charts. Easily create beautiful graphs and charts on your smartphone or tablet. The Chart Maker app has many different graphs to display your data. You can create both regular charts and pie charts. Simply select the appropriate schedule and add data to it. All created graphs and charts will be stored in the application. You can always edit a saved graph or chart, add data to it, or delete it.
Creating graphs and charts is incredibly easy!
The application has the most simple and intuitive interface. The application does not have many strange buttons, so you can easily create your first chart! All created graphics you can immediately send or save in PNG or PDF format. The application also provides the ability to quickly print your graphs.
Key features of the Chart Maker app:
- create a schedule
- create chart
- save your graphics in PDF or PNG format
- quickly print your schedule from your phone
- send your schedule or publish it on social networks
- store graphics in the phone memory
Types of graphs and charts that you can create:
- Pie chart (Pie)
- horizontal bar graph (Horizontal Bar)
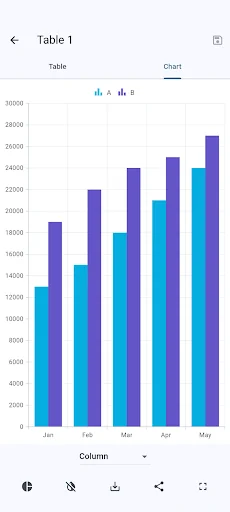
- Vertical bar graph (Vertical Bar)
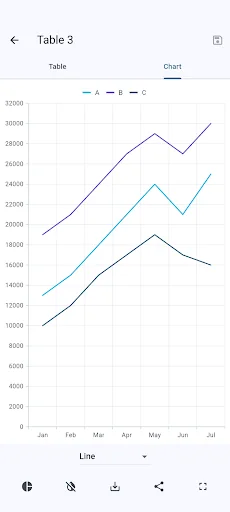
- Graphs in the form of lines (Line)
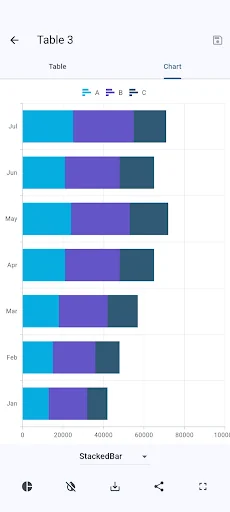
- Stacked bar graph (Stacked Bar)
- polar diagram (Polar Area)
- Radar chart (Radar)
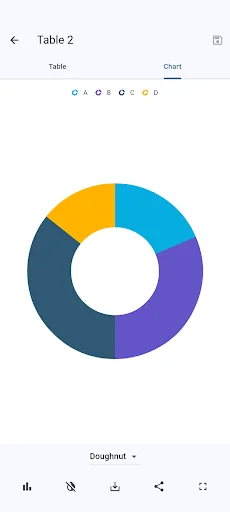
- Donut chart (Doughnut)
Create incredibly beautiful graphs and charts with this application. Sends your created graphs to friends or save on your device!
Comparable Android apps
The five apps in Tools with the closest revenue to Chart Maker: Graphs and charts. Click any to see its detail page.
Each forecast combines App Store rating, ratings count, monetisation model, pricing tier, IAP signals and ad-supported flag.
The base estimate is then multiplied by a per-category scaling factor learned from apps with founder-verified MRR.
Every number on this page comes from public APIs and bumetric's own snapshot history.
Full methodology covers input variables, accuracy bands per category and how we treat apps without comparable anchors.
See also the live data on Chart Maker: Graphs and charts's tracker page for current rating, reviews and snapshot timeline.
Building something similar? Get a free AI audit with $-revenue forecasts for every recommendation.

 GPS info
 HDWifiCamPro
 KiKi VPN - Secure VPN Proxy
 전화번호안심로그인
 TapTapSee