What AppChoices actually does (from store listing)
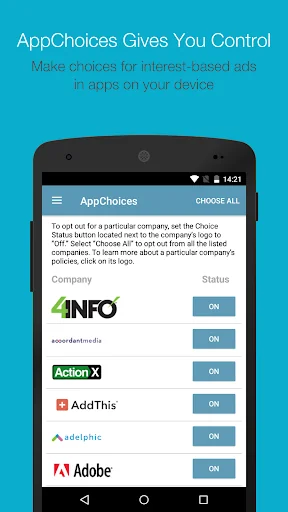
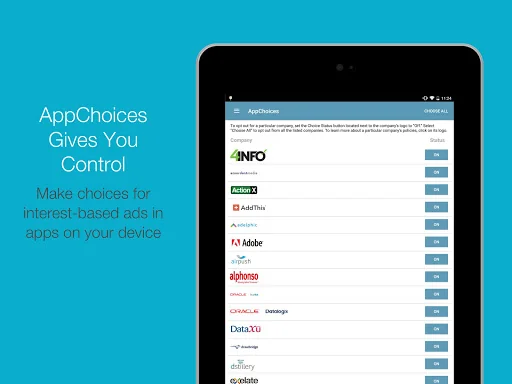
Control interest-based advertising on apps on your mobile device.
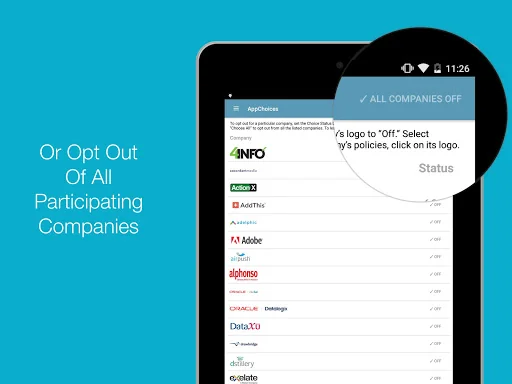
AppChoices gives you transparency with participating companies, and lets you limit their collection of cross-app data for interest-based ads. Brought to you by the Digital Advertising Alliance, and backed up by the DAA’s independent accountability program, AppChoices lets you opt out from interest-based advertising with a particular company, or “Choose All Companies” with one simple click.
Did you know that some of the ads y…
Control interest-based advertising on apps on your mobile device.
AppChoices gives you transparency with participating companies, and lets you limit their collection of cross-app data for interest-based ads. Brought to you by the Digital Advertising Alliance, and backed up by the DAA’s independent accountability program, AppChoices lets you opt out from interest-based advertising with a particular company, or “Choose All Companies” with one simple click.
Did you know that some of the ads you receive in apps are customized based on predictions about your interests generated from your app usage? This is called interest-based advertising (IBA). AppChoices gives you choices about whether you receive this type of advertising that is based on cross-app data collected over time across different apps and devices.
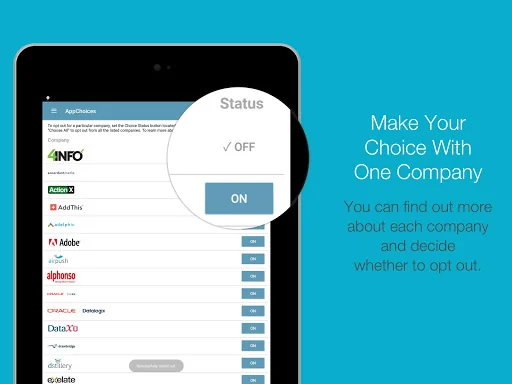
To opt out your device ID out of IBA from a particular company, simply navigate to Device ID-Based Choice tool and set the switch next to the company’s logo from “”ON” to “OFF”. AppChoices lets you decide which, if any, participating companies deliver interest-based advertising to your device.
Using the new Token ID-Based Choice (beta) tool, you can opt out or revoke having your data collected or used for IBA linked to the email address you provide.
When it comes to ads in your apps based on your interests, it’s your choice.
AppChoices también está disponible en español. Solo establece la configuración al idioma español.
You may still receive other types of advertising in your apps from participating DAA companies, and these companies (and other apps) may still collect information for other purposes consistent with the DAA Principles. You can learn more about these Principles and the DAA’s enforcement and accountability program by visiting www.aboutads.info/enforcement.
v2.2.0
Comparable Android apps
The five apps in Tools with the closest revenue to AppChoices. Click any to see its detail page.
Each forecast combines App Store rating, ratings count, monetisation model, pricing tier, IAP signals and ad-supported flag.
The base estimate is then multiplied by a per-category scaling factor learned from apps with founder-verified MRR.
Every number on this page comes from public APIs and bumetric's own snapshot history.
Full methodology covers input variables, accuracy bands per category and how we treat apps without comparable anchors.
See also the live data on AppChoices's tracker page for current rating, reviews and snapshot timeline.
Building something similar? Get a free AI audit with $-revenue forecasts for every recommendation.

 LoJack Go
 SPL | Saudi Post
 تمام لوحة المفاتيح - اليمن
 Find My Phone by Whistle
 Miracast