What Arcademics actually does (from store listing)
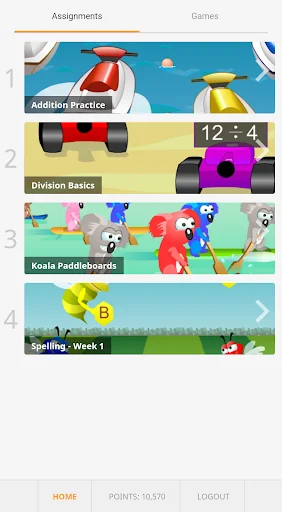
Play all your favorite educational games in one place.
Features:
• More than 60 games for K-8 in subjects such as math, language arts, and geography
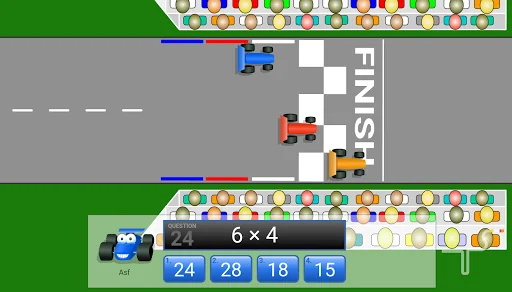
• Compete against your friends with engaging, real-time multiplayer
• Earn achievements and top scores through hard work and improvement
• Receive customized game content to fit individual needs
• Report progress so that performance can be tracked over time
Games Included:
• Alien Addition
• Bumper Boat Bash
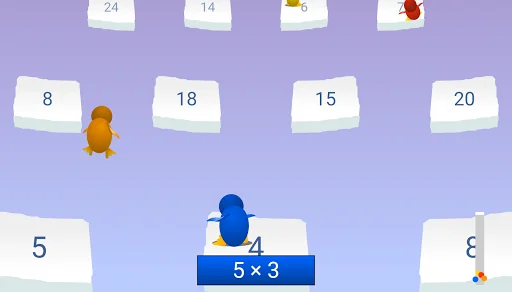
• Canoe Penguins
• Canoe P…
Play all your favorite educational games in one place.
Features:
• More than 60 games for K-8 in subjects such as math, language arts, and geography
• Compete against your friends with engaging, real-time multiplayer
• Earn achievements and top scores through hard work and improvement
• Receive customized game content to fit individual needs
• Report progress so that performance can be tracked over time
Games Included:
• Alien Addition
• Bumper Boat Bash
• Canoe Penguins
• Canoe Puppies
• Capital Penguin
• Coconut Vowels
• Country Toad
• Demolition Division
• Dirt Bike Comparing Fractions
• Dirt Bike Proportions
• Division Derby
• Dolphin Dash
• Dolphin Feed
• Drag Race Division
• Ducky Race
• Elephant Feed
• Four Wheel Fracas
• Furious Frogs
• Giraffe Dash
• Giraffe Karts
• Giraffe Pull
• Grand Prix Multiplication
• Hungry Puppies
• Integer Warp
• Island Chase Subtraction
• Jet Ski Addition
• Jumping Aliens
• Jumping Chicks
• Kangaroo Hop
• Kitten Hop
• Kitten Match
• Koala Karts
• Koala Paddleboards
• Martian Hoverboards
• Meteor Multiplication
• Minus Mission
• Octopus Feed
• Orbit Integers
• Otter Rush
• Penguin Hop
• Penguin Jump
• Pizza Pandas
• Pony Division
• Puppy Chase
• Puppy Hop
• Puppy Pull
• Ratio Blaster
• Ratio Martian
• Ratio Stadium
• Sailboat Subtraction
• Skateboard Pups
• Snow Sprint
• Space Jaunt
• Space Race
• Speedway
• Spelling Bees
• Spider Match
• Swimming Otters
• Tandem Turtles
• Toad Hop
• Tractor Multiplication
• Tugboat Addition
• Turtle Dash
• Verb Viper
• Word Frog
• Word Invasion
Comparable Android apps
The five apps in Education with the closest revenue to Arcademics. Click any to see its detail page.
Each forecast combines App Store rating, ratings count, monetisation model, pricing tier, IAP signals and ad-supported flag.
The base estimate is then multiplied by a per-category scaling factor learned from apps with founder-verified MRR.
Every number on this page comes from public APIs and bumetric's own snapshot history.
Full methodology covers input variables, accuracy bands per category and how we treat apps without comparable anchors.
See also the live data on Arcademics's tracker page for current rating, reviews and snapshot timeline.
Building something similar? Get a free AI audit with $-revenue forecasts for every recommendation.


 Stars and Planets
 Learn Web Development Guide
 كتبي Kutubee
 PHYSICS FORUM
 Toprak Video Çözüm