Tired of missing your coffee because you are out of coins?
Bored of topping up your key every single time?
Or to discover your favorite snack is out of stock?
Well, from now on all of this will be memories!
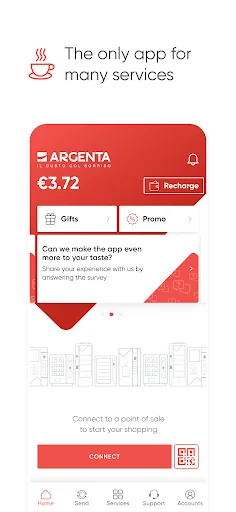
Download Argenta app, connect and pay in a few seconds!
With Argenta app you will:
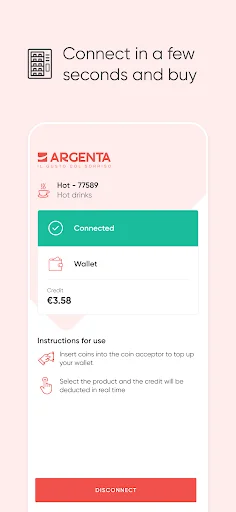
- Connect in a few moments tapping your smartphone to the machine box or selecting it from the list
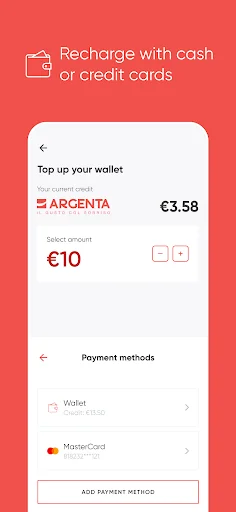
- Top-up your credit via cash, Paypal, credit card and many other virtual payment methods…
Tired of missing your coffee because you are out of coins?
Bored of topping up your key every single time?
Or to discover your favorite snack is out of stock?
Well, from now on all of this will be memories!
Download Argenta app, connect and pay in a few seconds!
With Argenta app you will:
- Connect in a few moments tapping your smartphone to the machine box or selecting it from the list
- Top-up your credit via cash, Paypal, credit card and many other virtual payment methods
- Transfer Credit to your friends
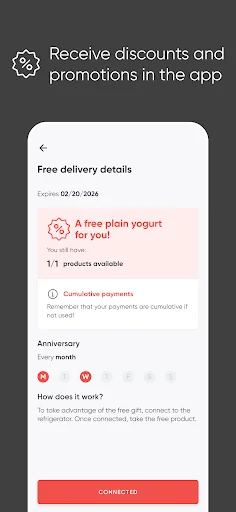
- Benefit from exclusive promotions and discounts
- Report malfunctions or out of stock products to our Customer Service
Comparable Android apps
The five apps in Food & Drink with the closest revenue to Argenta. Click any to see its detail page.
Each forecast combines App Store rating, ratings count, monetisation model, pricing tier, IAP signals and ad-supported flag.
The base estimate is then multiplied by a per-category scaling factor learned from apps with founder-verified MRR.
Every number on this page comes from public APIs and bumetric's own snapshot history.
Full methodology covers input variables, accuracy bands per category and how we treat apps without comparable anchors.
See also the live data on Argenta's tracker page for current rating, reviews and snapshot timeline.
Building something similar? Get a free AI audit with $-revenue forecasts for every recommendation.

 Akelni - Food Delivery
 Bolt Food: Delivery & Takeaway
 F&B ID App (Chatime Indonesia)
 24U
24U
 Barro's Pizza