1.3M Assets Tracked Updated 3 min ago Revenue Forecasts
Add an app Create Account Sign In
Home
Assembly Toolbox icon

How much does Assembly Toolbox earn?

Android app from 3rd Party Solutions, LLC · Tools

ML forecast ★ 3.1 · 234 Free

~236/mo

ML revenue forecast. Calibrated against 77129 apps in this category.

Confidence band
±15%
High — many comparable apps with verified data

At a glance

What the app looks like

Live screenshots from the Play Store, captured by our snapshot worker. Tap any image to enlarge.
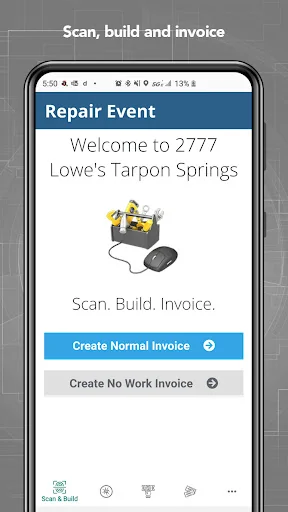
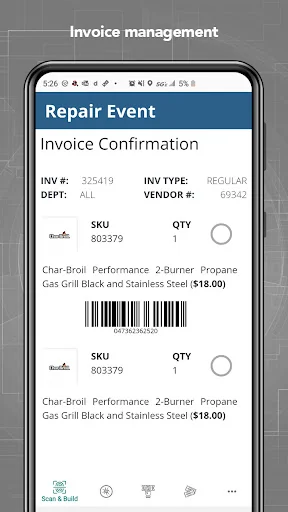
Assembly Toolbox screenshot 1 Assembly Toolbox screenshot 2 Assembly Toolbox screenshot 3

Assembly Toolbox's revenue trajectory

Forecast revenue from snapshot history. Last 1 months.

Where Assembly Toolbox sits in Tools

Revenue distribution of 77129 comparable apps. Assembly Toolbox highlighted.

Assembly Toolbox vs comparable apps

Revenue trajectory side-by-side. Bold = Assembly Toolbox, ghosted = peers.

App spec

Version
4.2.0
Last update
Aug 03, 2026
Launched
Feb 19, 2020
Price
Free
Monetization
Free

What Assembly Toolbox actually does (from store listing)

The Assembly Toolbox enables authorized assembly technicians to: • Check daily schedule • Utilize the mapping function to get to the work site • Geolocate check in and check out for assembly time accuracy • Communicate assembly load • Scan, build and invoice for precision assembly accuracy • Photo product verification • Digital invoice signing the ideal solution to optimize performance and mitigate risk exposure

Comparable Android apps

The five apps in Tools with the closest revenue to Assembly Toolbox. Click any to see its detail page.

AppRevenueRatingRatings
Power Meter icon Power Meter 236 ★ 3.1 169
Quick Hotspot - Homescreen Hot icon Quick Hotspot - Homescreen Hot 236 ★ 2.7 134
Safespot Guard icon Safespot Guard 236 — 0
ZTerminal - USB Terminal icon ZTerminal - USB Terminal 236 ★ 4.6 90
모바일보호 서비스 (삼성전용) icon 모바일보호 서비스 (삼성전용) 236 — 0
Own Assembly Toolbox? Replace our estimate with your real revenue via Stripe Connect or ASC. Get a public Verified badge.
Claim & verify →

How we calculated this

Each forecast combines App Store rating, ratings count, monetisation model, pricing tier, IAP signals and ad-supported flag. The base estimate is then multiplied by a per-category scaling factor learned from apps with founder-verified MRR. Every number on this page comes from public APIs and Bumetric's own snapshot history.

Full methodology covers input variables, accuracy bands per category and how we treat apps without comparable anchors. See also the live data on Assembly Toolbox's tracker page for current rating, reviews and snapshot timeline.

Building something similar? Get a free AI audit with $-revenue forecasts for every recommendation.
Audit my app →