What Attendance actually does (from store listing)
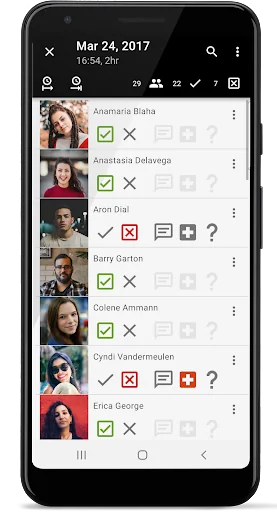
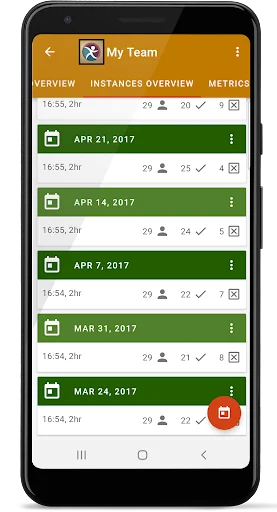
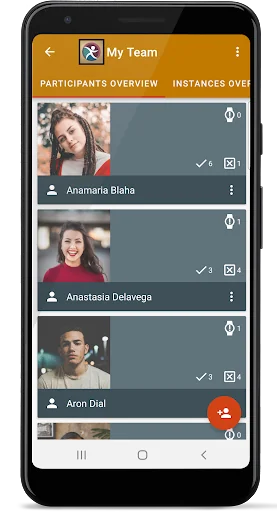
Create groups of persons, define dates of instances and track the attendance of each person during each instance.
Main features:
-App content available on any Android device you own. Automatically kept in sync.
-Import persons from your contacts or a Google spreadsheet
-Import or manually set thumbnails to the participants
-Define custom event icons (for example containing your brand or company logo)
-Visual graphs that show you the overall metrics for defined periods of time
-(Option…
Create groups of persons, define dates of instances and track the attendance of each person during each instance.
Main features:
-App content available on any Android device you own. Automatically kept in sync.
-Import persons from your contacts or a Google spreadsheet
-Import or manually set thumbnails to the participants
-Define custom event icons (for example containing your brand or company logo)
-Visual graphs that show you the overall metrics for defined periods of time
-(Optional) extra information: person is late/payment done/child pickup etc.
-Reach out to your participant by mail or text messages
-Create up to 5 events, 25 instances and 50 participants
With optional basic subscription:
-No limits on the amount of events, instances and participants
-Advanced exports (Excel, xlsx format)
-Advanced Metrics (Instance overviews, Participant details etc.)
-No ads
With optional pro subscription:
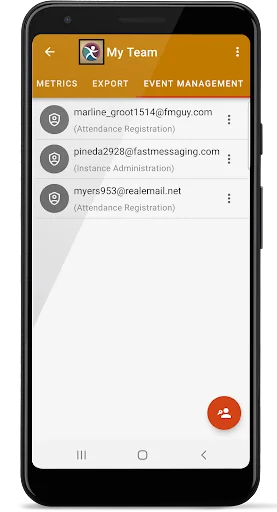
-The above and ability to invite others to help you manage the attendance of your groups (in real-time)
Examples use cases for this app are:
• Keeping track of attendance during sport training sessions (with multiple coaches)
• Tracking students (for schools and teachers)
• Track participation during regular work meetings
• Track Participation for Sunday schools
• Scouts
• (Summer) camps
• Music (wind-bands)
• Etc.
Comparable Android apps
The five apps in Productivity with the closest revenue to Attendance. Click any to see its detail page.
Each forecast combines App Store rating, ratings count, monetisation model, pricing tier, IAP signals and ad-supported flag.
The base estimate is then multiplied by a per-category scaling factor learned from apps with founder-verified MRR.
Every number on this page comes from public APIs and Bumetric's own snapshot history.
Full methodology covers input variables, accuracy bands per category and how we treat apps without comparable anchors.
See also the live data on Attendance's tracker page for current rating, reviews and snapshot timeline.
Building something similar? Get a free AI audit with $-revenue forecasts for every recommendation.

 Banana Split, Bill Splitter
 Nepal Police
 Mannu (Mobile Application on M
 Counter List
 French Keyboard