ML revenue forecast.
Calibrated against 77129 apps in this category.
Confidence band
±15%
High — many comparable apps with verified data
At a glance
Tracks close to the Android app category median (189/mo).
Ranks #29,280 of 77,129 in Tools (top 38.0% by revenue).
Launched Feb 17, 2018 · last updated Oct 26, 2024.
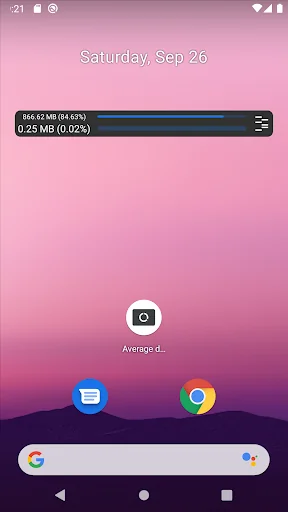
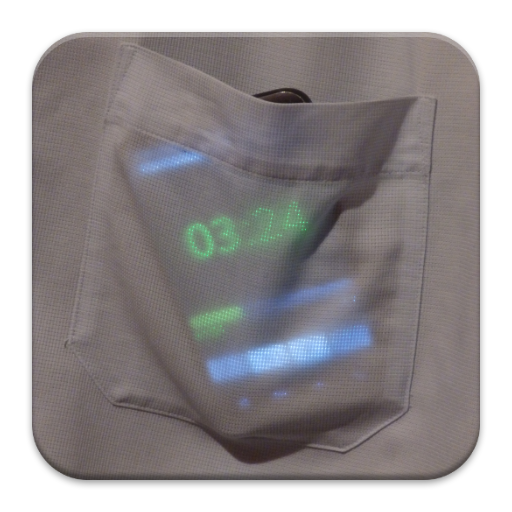
What the app looks like
Live screenshots from the Play Store, captured by our snapshot worker. Tap any image to enlarge.
Average data usage widget's revenue trajectory
Forecast revenue from snapshot history. Last 1 months.
Where Average data usage widget sits in Tools
Revenue distribution of 77129 comparable apps. Average data usage widget highlighted.
Average data usage widget vs comparable apps
Revenue trajectory side-by-side. Bold = Average data usage widget, ghosted = peers.
App spec
Version
4.1
Last update
Oct 26, 2024
Launched
Feb 17, 2018
Price
Free
Monetization
Free
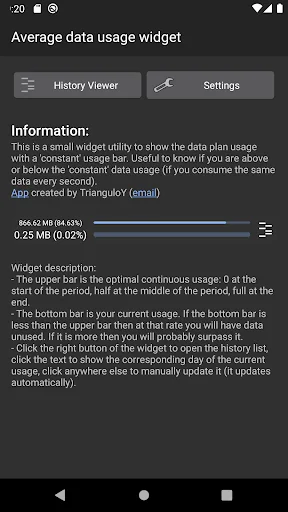
What Average data usage widget actually does (from store listing)
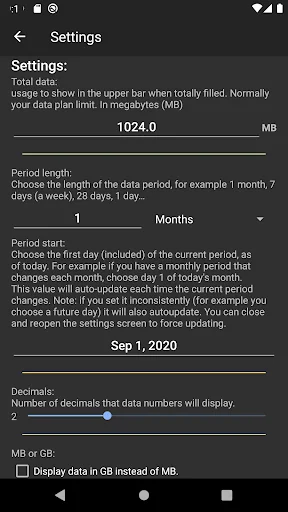
New: You can now configure the start and duration of the period, for example one week, 28 days, or even one year.
Do you have an almost unlimited data plan and you never consume all your data? Lucky you! Unfortunately this app will be useless in this situation.
On the other hand: do you have a limited data plan and it has happened to you:
a) You always spend too much data on the first days of the period, and you have few left at the end?
or
b) You try not to spend too much data at t…
New: You can now configure the start and duration of the period, for example one week, 28 days, or even one year.
Do you have an almost unlimited data plan and you never consume all your data? Lucky you! Unfortunately this app will be useless in this situation.
On the other hand: do you have a limited data plan and it has happened to you:
a) You always spend too much data on the first days of the period, and you have few left at the end?
or
b) You try not to spend too much data at the beginning of the period, and then you end with unused data?
or
c) You always wanted to know 'Did I spent too much already?' 'Am I above an average usage?'.
Then this app will (I hope) help you!
It shows your data usage (bottom bar, how much you already used) with an ideal 'average data usage' (top bar, how much you would have used by downloading the same amount of bytes every second in the period). This way with just one look you can check if you are above or below the 'average data usage'.
- If the top bar is longer than the bottom: Good! You can download a bit more and still have at the end of the period.
- If the top bar is shorter than the bottom: Not good! You need to stop using too much data, otherwise you'll end with no more left.
Isn't this useful? I think it is, and that's why I (TrianguloY) published it. It doesn't contains ads, and it is absurdly lightweight, so give it a try.
If you have any suggestion or comment leave one or send an email.
DISCLAIMER!!!!
Please note that the current consumption is measured by your device and may differ with your company measurement. I can't take responsibility if the displayed data usage is wrong.
Permissions:
- READ_PHONE_STATE - Permission needed to get the device identification only. No other data is retrieved nor used.
More info here: https://developer.android.com/reference/android/telephony/TelephonyManager.html#getSubscriberId().
- PACKAGE_USAGE_STATS - Permission needed to get the current usage from the usage service. No other data is retrieved nor used.
More info here: https://developer.android.com/reference/android/app/usage/NetworkStatsManager.html#querySummaryForDevice(int,%20java.lang.String,%20long,%20long)
NOTE: there is no internet permission, there are no ads so it is not necessary.
---------------------------------
The source code is available here: https://github.com/TrianguloY/Average-data-usage-widget
Comparable Android apps
The five apps in Tools with the closest revenue to Average data usage widget. Click any to see its detail page.
Each forecast combines App Store rating, ratings count, monetisation model, pricing tier, IAP signals and ad-supported flag.
The base estimate is then multiplied by a per-category scaling factor learned from apps with founder-verified MRR.
Every number on this page comes from public APIs and bumetric's own snapshot history.
Full methodology covers input variables, accuracy bands per category and how we treat apps without comparable anchors.
See also the live data on Average data usage widget's tracker page for current rating, reviews and snapshot timeline.
Building something similar? Get a free AI audit with $-revenue forecasts for every recommendation.

 Razer Chroma RGB
 RouteThis Helps (Route This)
 Authenticator App: 2FA Code
 Wi-Fi Chat
 Silent Presentation Timer