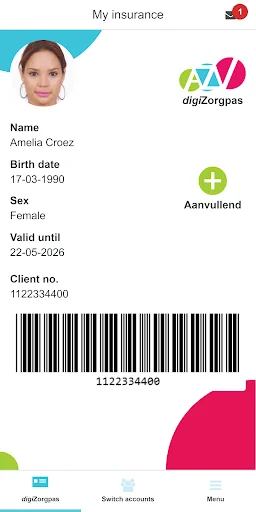
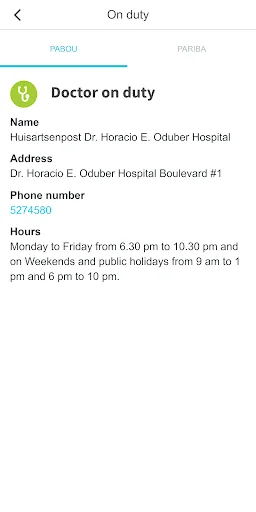
In the AZV app you will find your digiZorgpas which is a proof of membership which has to be shown to your care provider in order to get service via AZV.
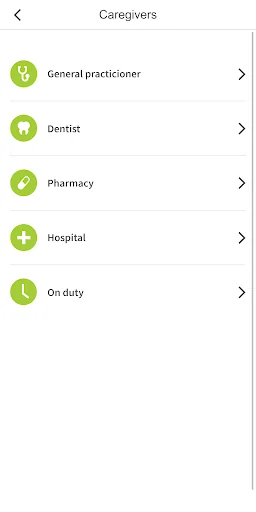
You can also see who your general practitioner is, your dentist and your pharmacy and easily contact them by phone or email.
Parents can add the membership card of their children to the app. If the children are younger than 18 years and live on the same address, you can do this from the comfort of your home. If you want to add someone you…
In the AZV app you will find your digiZorgpas which is a proof of membership which has to be shown to your care provider in order to get service via AZV.
You can also see who your general practitioner is, your dentist and your pharmacy and easily contact them by phone or email.
Parents can add the membership card of their children to the app. If the children are younger than 18 years and live on the same address, you can do this from the comfort of your home. If you want to add someone you are taking care of that is not living on the same address, you must contact AZV via klantenservice@uoazv.aw
Comparable Android apps
The five apps in Medical with the closest revenue to AZV Aruba. Click any to see its detail page.
Each forecast combines App Store rating, ratings count, monetisation model, pricing tier, IAP signals and ad-supported flag.
The base estimate is then multiplied by a per-category scaling factor learned from apps with founder-verified MRR.
Every number on this page comes from public APIs and bumetric's own snapshot history.
Full methodology covers input variables, accuracy bands per category and how we treat apps without comparable anchors.
See also the live data on AZV Aruba's tracker page for current rating, reviews and snapshot timeline.
Building something similar? Get a free AI audit with $-revenue forecasts for every recommendation.
 سكري
سكري
 Nervous System Anatomy Pro.
 I care WISSEN TO GO 2.0
 NefroConsultor
 인제대학교 백병원