ML revenue forecast.
Calibrated against 14404 apps in this category.
Confidence band
±15%
High — many comparable apps with verified data
At a glance
Earns 28.25× more than the category median (233/mo).
Ranks #286 of 14,404 in Adventure (top 2.0% by revenue).
Launched Mar 23, 2014 · last updated Apr 06, 2026.
What the app looks like
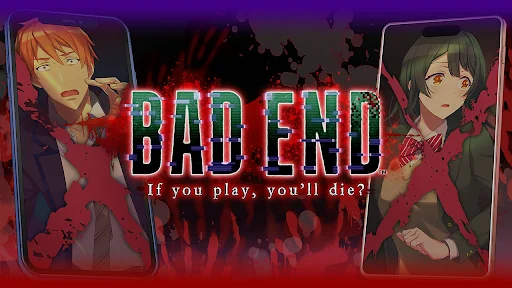
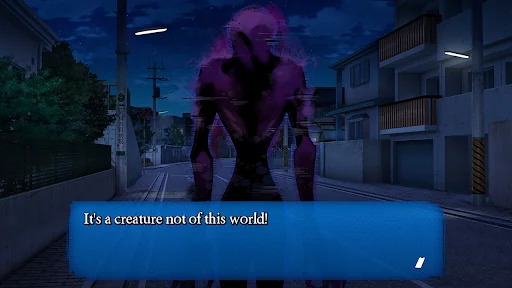
Live screenshots from the Play Store, captured by our snapshot worker. Tap any image to enlarge.
BAD END's revenue trajectory
Forecast revenue from snapshot history. Last 1 months.
Where BAD END sits in Adventure
Revenue distribution of 14404 comparable apps. BAD END highlighted.
BAD END vs comparable apps
Revenue trajectory side-by-side. Bold = BAD END, ghosted = peers.
App spec
Version
8.3.0
Last update
Apr 06, 2026
Launched
Mar 23, 2014
Price
$3.99
Monetization
Paid
What BAD END actually does (from store listing)
-- Latest support information (April 6th, 2026) --
* It has been confirmed to work properly on Android 16.
-- Story --
Kyuuhei Inui has never been one to take rumors as anything but that - rumors, until his best friend had died while playing the game...
Kyuuhei is driven to find out the truth behind his friend's mysterious death by any means possible.
After exhausting all ideas, he decided the only way to find out the truth is to play 'BAD END' himself.
Will Kyuuhei risk his life to ge…
-- Latest support information (April 6th, 2026) --
* It has been confirmed to work properly on Android 16.
-- Story --
Kyuuhei Inui has never been one to take rumors as anything but that - rumors, until his best friend had died while playing the game...
Kyuuhei is driven to find out the truth behind his friend's mysterious death by any means possible.
After exhausting all ideas, he decided the only way to find out the truth is to play 'BAD END' himself.
Will Kyuuhei risk his life to get to the bottom of the game's mystery or will he meet his demise?
-- Supported languages --
Japanese, English, German, Spanish, French
-- Official website --
Introducing characters and others.
https://arai-create.net/en/badend/
-- Support information --
* If any errors are found while playing, please report them to us by E-mail before posting them in a review. We will fix the errors as soon as possible. Thank you for your understanding.
* Please feel free to E-mail us with any questions regarding the game.
Thank you!
Each forecast combines App Store rating, ratings count, monetisation model, pricing tier, IAP signals and ad-supported flag.
The base estimate is then multiplied by a per-category scaling factor learned from apps with founder-verified MRR.
Every number on this page comes from public APIs and bumetric's own snapshot history.
Full methodology covers input variables, accuracy bands per category and how we treat apps without comparable anchors.
See also the live data on BAD END's tracker page for current rating, reviews and snapshot timeline.
Building something similar? Get a free AI audit with $-revenue forecasts for every recommendation.




 Clockwork Tales (Full)
 MechaNika
 Darkarta (Full, HOPA)
 Monster Adventures
 Darkness and Flame 1 CE