ML revenue forecast.
Calibrated against 5375 apps in this category.
Confidence band
±15%
High — many comparable apps with verified data
At a glance
Earns 1.73× more than the category median (254/mo).
Ranks #1,885 of 5,375 in Strategy (top 35.1% by revenue).
Launched Jan 26, 2014 · last updated Feb 09, 2014.
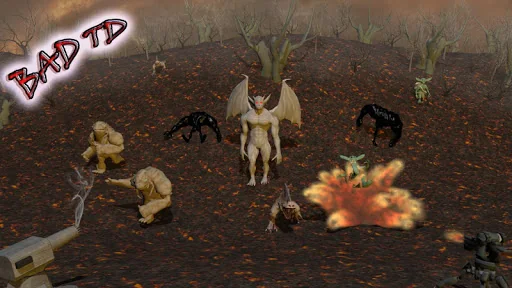
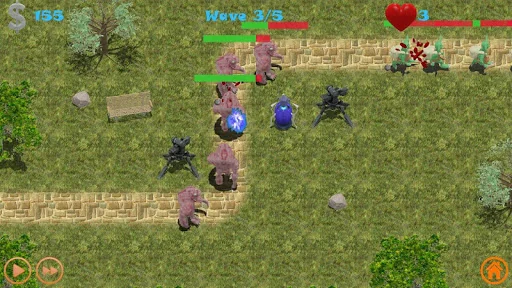
What the app looks like
Live screenshots from the Play Store, captured by our snapshot worker. Tap any image to enlarge.
Bad TD's revenue trajectory
Forecast revenue from snapshot history. Last 1 months.
Where Bad TD sits in Strategy
Revenue distribution of 5375 comparable apps. Bad TD highlighted.
Bad TD vs comparable apps
Revenue trajectory side-by-side. Bold = Bad TD, ghosted = peers.
App spec
Version
1.5
Last update
Feb 09, 2014
Launched
Jan 26, 2014
Price
Free
Monetization
Free
What Bad TD actually does (from store listing)
It is an epic Tower Defense game!
Events unfold in the near future... Technology have reached great heights and people have learned how to create a super-weapon... No wonder! After all, at the same time, our world have collapsed utter chaos. Monsters with the afterlife have begun to attack our world.
You are in the most demanding role.
You will need to learn all the characteristics of the new created towers and build them in the most optimal locations to defend and defeat this bloody war.
…
It is an epic Tower Defense game!
Events unfold in the near future... Technology have reached great heights and people have learned how to create a super-weapon... No wonder! After all, at the same time, our world have collapsed utter chaos. Monsters with the afterlife have begun to attack our world.
You are in the most demanding role.
You will need to learn all the characteristics of the new created towers and build them in the most optimal locations to defend and defeat this bloody war.
Each forecast combines App Store rating, ratings count, monetisation model, pricing tier, IAP signals and ad-supported flag.
The base estimate is then multiplied by a per-category scaling factor learned from apps with founder-verified MRR.
Every number on this page comes from public APIs and bumetric's own snapshot history.
Full methodology covers input variables, accuracy bands per category and how we treat apps without comparable anchors.
See also the live data on Bad TD's tracker page for current rating, reviews and snapshot timeline.
Building something similar? Get a free AI audit with $-revenue forecasts for every recommendation.


 Vermeer Mobile
 Expert Bubble Shooter
 Hooman Invaders Tower Defense
 Steves Castle - New Adventures
 Age of Dynasties: Crusader War