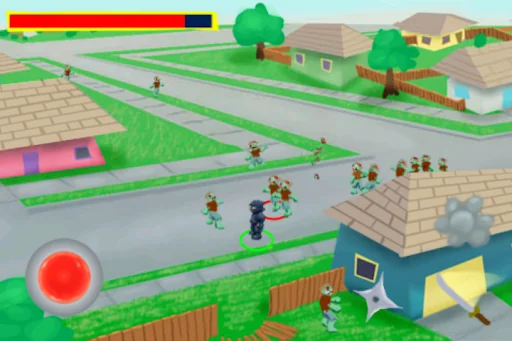
Ever wonder what would happen if a Pirate invaded a Japanese village or what it would be like if a Raptor was set loose during a Zombie invasion in your neighborhood? Well now your wildest fantasies can be played out in Bad-Toys!
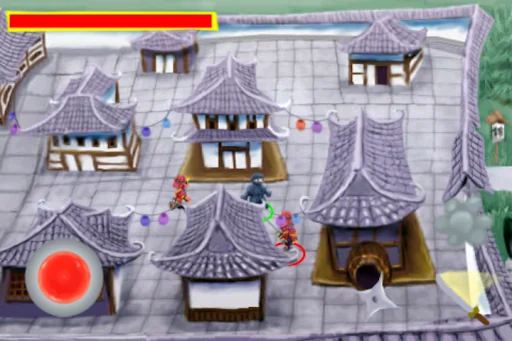
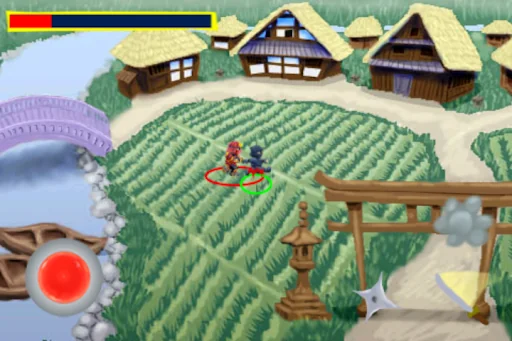
Bad-Toys is a humorous, fast-paced, action game with a fun and crazy cast spreading mayhem around the world. The game includes 8 characters and 9 settings which are all playable and unlockable.
PLEASE NOTE:
-Free and without ads. Enjoy!
-13MB will be downlo…
Ever wonder what would happen if a Pirate invaded a Japanese village or what it would be like if a Raptor was set loose during a Zombie invasion in your neighborhood? Well now your wildest fantasies can be played out in Bad-Toys!
Bad-Toys is a humorous, fast-paced, action game with a fun and crazy cast spreading mayhem around the world. The game includes 8 characters and 9 settings which are all playable and unlockable.
PLEASE NOTE:
-Free and without ads. Enjoy!
-13MB will be downloaded to your SD card to save room for Apps.
Comparable Android apps
The five apps in Arcade with the closest revenue to Bad-Toys. Click any to see its detail page.
Each forecast combines App Store rating, ratings count, monetisation model, pricing tier, IAP signals and ad-supported flag.
The base estimate is then multiplied by a per-category scaling factor learned from apps with founder-verified MRR.
Every number on this page comes from public APIs and bumetric's own snapshot history.
Full methodology covers input variables, accuracy bands per category and how we treat apps without comparable anchors.
See also the live data on Bad-Toys's tracker page for current rating, reviews and snapshot timeline.
Building something similar? Get a free AI audit with $-revenue forecasts for every recommendation.

 Mob Control
 Root Beer Tapper
 The Jumpers - Mega Jump Game
 Air Dance
 Drop Ball Blast: Salvage Earth