What Beer diary actually does (from store listing)
An application not only for http://www.pivnidenicek.cz users where beer lovers share their experience from pubs, restaurants, honky-tonks and beer-stands. The Beer Diary brings together enthusiasts who love good beer, the culture around it and for whom it is a pleasure to help others discover places where the beer-making is a serious craft.
KEY FUNCTIONS:
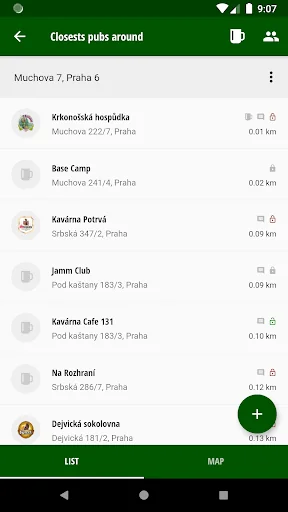
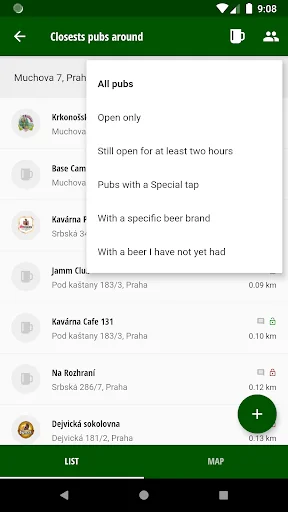
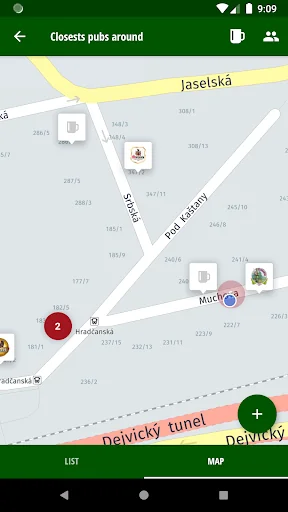
• A list and map of pubs in your area; including the beer brand and price, its rating, opening hours, etc.
• Your bill; your consumptio…
An application not only for http://www.pivnidenicek.cz users where beer lovers share their experience from pubs, restaurants, honky-tonks and beer-stands. The Beer Diary brings together enthusiasts who love good beer, the culture around it and for whom it is a pleasure to help others discover places where the beer-making is a serious craft.
KEY FUNCTIONS:
• A list and map of pubs in your area; including the beer brand and price, its rating, opening hours, etc.
• Your bill; your consumption and total spending on your beer is under your control
• Adding of beers, new pubs and newly tasted beer brands
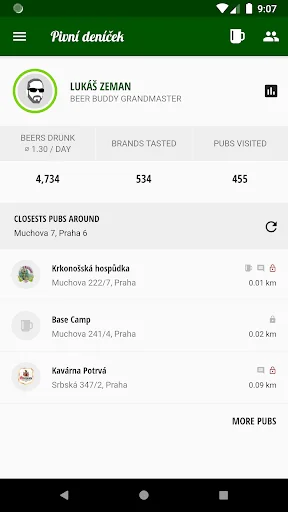
• Personal beer stats always at hand
• Recommend (and have recommended) which of the beers on offer is the best
• View the map to see where your beer buddies are currently having their beer
• And much more….
Comparable Android apps
The five apps in Food & Drink with the closest revenue to Beer diary. Click any to see its detail page.
Each forecast combines App Store rating, ratings count, monetisation model, pricing tier, IAP signals and ad-supported flag.
The base estimate is then multiplied by a per-category scaling factor learned from apps with founder-verified MRR.
Every number on this page comes from public APIs and bumetric's own snapshot history.
Full methodology covers input variables, accuracy bands per category and how we treat apps without comparable anchors.
See also the live data on Beer diary's tracker page for current rating, reviews and snapshot timeline.
Building something similar? Get a free AI audit with $-revenue forecasts for every recommendation.

 Foody: Food & Grocery Delivery
 빽다방
빽다방
 عافيات
 Шоколадница
 Sanjeev Kapoor Healthy Kitchen