What Bigger Dot actually does (from store listing)
INTRODUCE
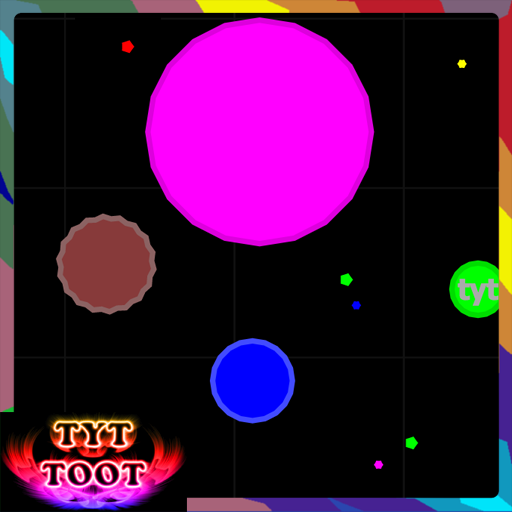
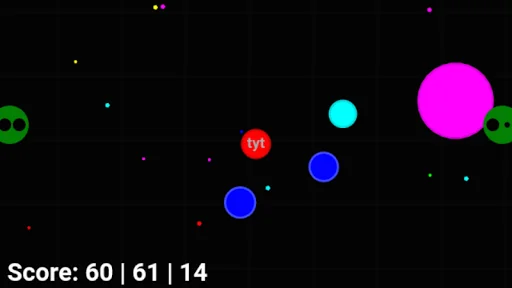
The game simulates the growth of bacteria, when you are bigger than your opponent you can eat them and your size will be increased.
Moving skillfully is the best way for you to grow quickly, everything in front of you can be eaten. To become the biggest you need to eat a lot and limit your elements as food for other objects.
Join the game community to win the glory of the seasons, you can become a master and take the No. 1 position in the future.
HOW TO PLAY
Rely on the …
The game simulates the growth of bacteria, when you are bigger than your opponent you can eat them and your size will be increased.
Moving skillfully is the best way for you to grow quickly, everything in front of you can be eaten. To become the biggest you need to eat a lot and limit your elements as food for other objects.
Join the game community to win the glory of the seasons, you can become a master and take the No. 1 position in the future.
HOW TO PLAY
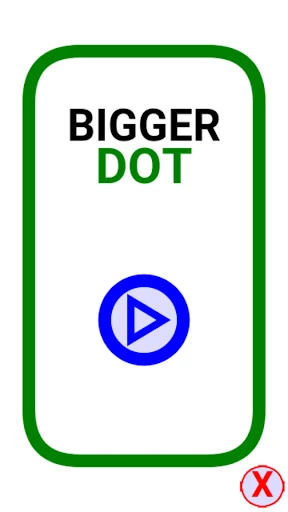
Rely on the control panel to orient your elements as you want, find objects on the screen, eat and absorb them to increase the size of your elements.
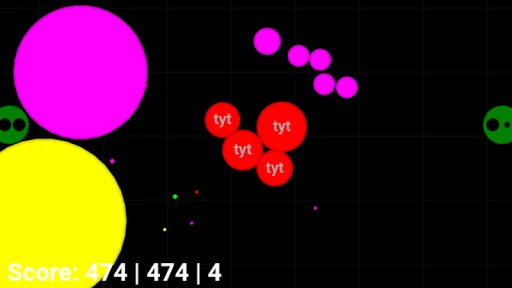
You can split into multiple elements to speed up and eat other elements faster, easier. In addition, you can extract immobile elements to hoard or deceive other objects.
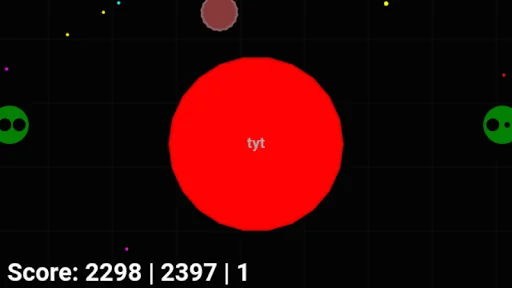
When you eat an explosive bacteria you will be split into several parts depending on the size of the particle that eats the explosive bacteria, be careful if you are too small you will be swallowed by the explosive bacteria.
FUNCTIONS
The simple controller is configured by default with the mouse for the web version and the scroll wheel for the mobile version.
You can change the controller to your liking via the switch controller button in the upper left corner.
Sign up, change your character's name, choose to see a list of players from previous seasons and share on the online leaderboard.
Online play mode with friends, save your best score.
Share apps through the sharing apps available in the device.
Instructions on how to play and share real combat experience.
Reviews on the app store.
CONTACT
Please contact if you want to share something with us. (Email address: trochoicodien@gmail.com).
Wish you have moments of relaxation and fun.
Thanks for watching!
Comparable Android apps
The five apps in Action with the closest revenue to Bigger Dot. Click any to see its detail page.
Each forecast combines App Store rating, ratings count, monetisation model, pricing tier, IAP signals and ad-supported flag.
The base estimate is then multiplied by a per-category scaling factor learned from apps with founder-verified MRR.
Every number on this page comes from public APIs and bumetric's own snapshot history.
Full methodology covers input variables, accuracy bands per category and how we treat apps without comparable anchors.
See also the live data on Bigger Dot's tracker page for current rating, reviews and snapshot timeline.
Building something similar? Get a free AI audit with $-revenue forecasts for every recommendation.
 AntiAirCraft
 Combat Strike CS FPS GO Online
 (re)format Z:
 Aaaaah
 Rabbit Hunting Bow Games