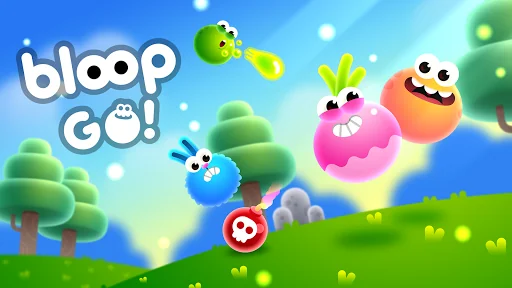
Bloop Go! is a fun physics-based multiplayer racing game.
Roll, bounce, crush and destroy your opponents with crazy power ups to reach the finish line.
Game Features:
- Unlock dozens of amazing powers
- Choose from 30+ awesome characters with their own skills
- Collect stars to claim incredible rewards
- Race against random opponents in real-time
- Roll and jump in 5 unique worlds
- Enjoy fast action gameplay and squishy physics
- Climb the leaderboard and challenge the best pl…
Bloop Go! is a fun physics-based multiplayer racing game.
Roll, bounce, crush and destroy your opponents with crazy power ups to reach the finish line.
Game Features:
- Unlock dozens of amazing powers
- Choose from 30+ awesome characters with their own skills
- Collect stars to claim incredible rewards
- Race against random opponents in real-time
- Roll and jump in 5 unique worlds
- Enjoy fast action gameplay and squishy physics
- Climb the leaderboard and challenge the best players in the world!
Comparable Android apps
The five apps in Racing with the closest revenue to Bloop Go!. Click any to see its detail page.
Each forecast combines App Store rating, ratings count, monetisation model, pricing tier, IAP signals and ad-supported flag.
The base estimate is then multiplied by a per-category scaling factor learned from apps with founder-verified MRR.
Every number on this page comes from public APIs and bumetric's own snapshot history.
Full methodology covers input variables, accuracy bands per category and how we treat apps without comparable anchors.
See also the live data on Bloop Go!'s tracker page for current rating, reviews and snapshot timeline.
Building something similar? Get a free AI audit with $-revenue forecasts for every recommendation.


 Happy Guts Racing
 Lethal Race
 Police Vs Robbers 2
 Rice Burner
 Truck Parking