What Blu Escape actually does (from store listing)
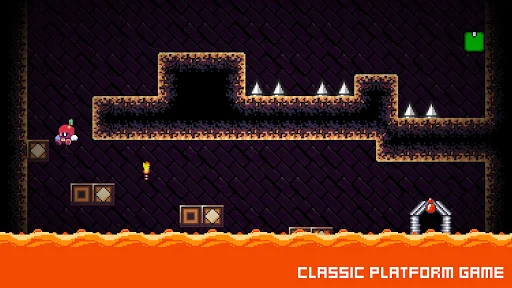
Introducing Blu Escape; the latest run and jump game that is very easy to play but very hard to master.
Are you looking for a great adventure game that you can enjoy playing for hours nonstop?
Do you want to get a mobile hardcore platformer game where your main mission is to run and jump to finish each level and go to the following one?
If your answer to one of these questions is yes, then you must play Blu Escape on your Android smartphone or tablet to start playing the addictive retro d…
Introducing Blu Escape; the latest run and jump game that is very easy to play but very hard to master.
Are you looking for a great adventure game that you can enjoy playing for hours nonstop?
Do you want to get a mobile hardcore platformer game where your main mission is to run and jump to finish each level and go to the following one?
If your answer to one of these questions is yes, then you must play Blu Escape on your Android smartphone or tablet to start playing the addictive retro dungeon game ever.
Blu Escape is a new game for you and for all your family, it will challenge your brain and skills to see if you will be able to complete each level.
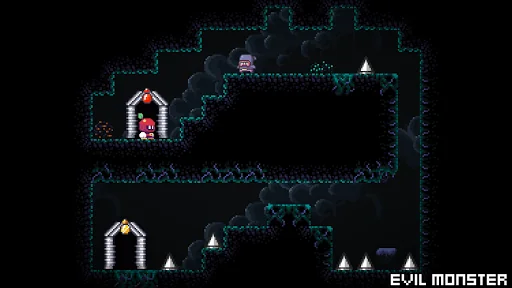
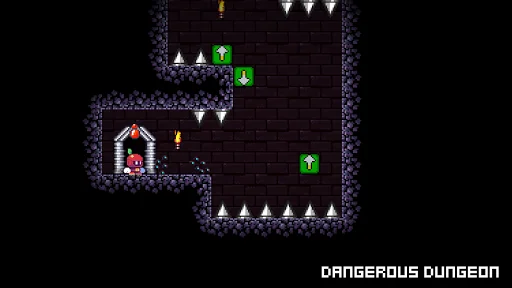
The objective of our adventure game is to take control of the character in a dangerous dungeon environment, run and jump till you reach the exit door to complete the current level and go to the following one.
But, keep in mind that your mission will not be that easy because there are many obstacles and you should not hit them or you will lose.
★★ Those are the TOP features of Blu Escape ★★
✓ Our retro game is very easy to play and it doesn’t require any special skills.
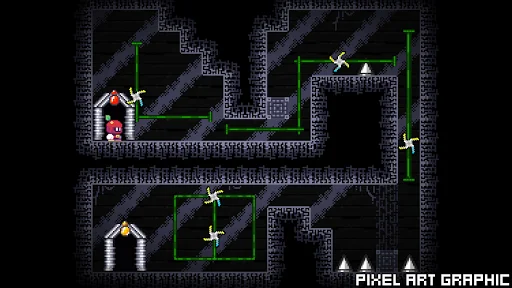
✓ A very well designed classic environment that will let you keep playing for hours nonstop. You will never feel bored.
✓ Easy and Hard levels.
✓ Hardcore platformer.
✓ We added a very wide selection of levels and we guarantee that you will keep playing for hours nonstop.
I am one person independent game developer, any feedback, ideas or suggestion for this game would be greatly appreciated. Thank you.
Note:
This game is required Android System WebView latest version. Please update your Android WebView to the latest version (https://play.google.com/store/apps/details?id=com.google.android.webview&hl=en_US)
Comparable Android apps
The five apps in Casual with the closest revenue to Blu Escape. Click any to see its detail page.
Each forecast combines App Store rating, ratings count, monetisation model, pricing tier, IAP signals and ad-supported flag.
The base estimate is then multiplied by a per-category scaling factor learned from apps with founder-verified MRR.
Every number on this page comes from public APIs and bumetric's own snapshot history.
Full methodology covers input variables, accuracy bands per category and how we treat apps without comparable anchors.
See also the live data on Blu Escape's tracker page for current rating, reviews and snapshot timeline.
Building something similar? Get a free AI audit with $-revenue forecasts for every recommendation.

 おやじ菌 培養(ビン) 【放置・育成】
 Hotel Slime - Clicker Game
 Spider
 Whittler
 Leo's Gun Defender