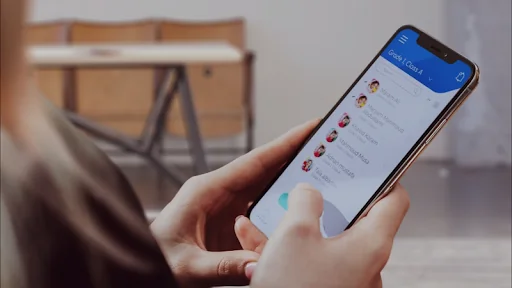
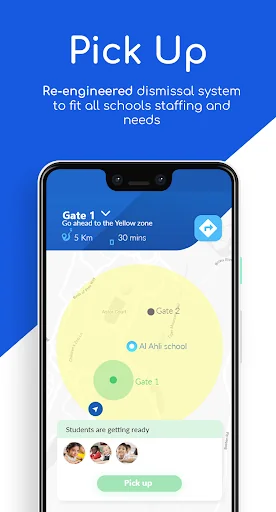
With the help of technology, you can save up to 50% of the total time spent in the dismissal process and improve traffic flow. The app is equipped to safely monitor and track the driver once dismissed from school till home arrival. Also, BlueRide Ease Communication between School administration and parents at no cost through app notifications.
- Pre-arrival notification for the student to get ready
- Identity verification every time your student leaves the school
- Add helper and manage t…
With the help of technology, you can save up to 50% of the total time spent in the dismissal process and improve traffic flow. The app is equipped to safely monitor and track the driver once dismissed from school till home arrival. Also, BlueRide Ease Communication between School administration and parents at no cost through app notifications.
- Pre-arrival notification for the student to get ready
- Identity verification every time your student leaves the school
- Add helper and manage their permissions to pick-up your student
- Get notified and track your student on the map till he
she reaches home safely.
Comparable Android apps
The five apps in Education with the closest revenue to BlueRide. Click any to see its detail page.
Each forecast combines App Store rating, ratings count, monetisation model, pricing tier, IAP signals and ad-supported flag.
The base estimate is then multiplied by a per-category scaling factor learned from apps with founder-verified MRR.
Every number on this page comes from public APIs and bumetric's own snapshot history.
Full methodology covers input variables, accuracy bands per category and how we treat apps without comparable anchors.
See also the live data on BlueRide's tracker page for current rating, reviews and snapshot timeline.
Building something similar? Get a free AI audit with $-revenue forecasts for every recommendation.


 GCU Welcome
 Instituto La Paz
 Terzaghi Institute
 Romanian Arabic Translator
 Corpo Humano RA