ML revenue forecast.
Calibrated against 77129 apps in this category.
Confidence band
±15%
High — many comparable apps with verified data
At a glance
Earns 1.54× more than the category median (189/mo).
Ranks #22,365 of 77,129 in Tools (top 29.0% by revenue).
Launched Aug 11, 2013 · last updated Apr 19, 2026.
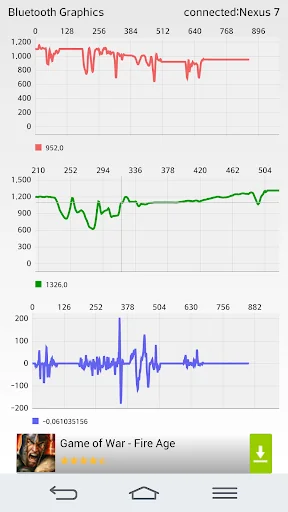
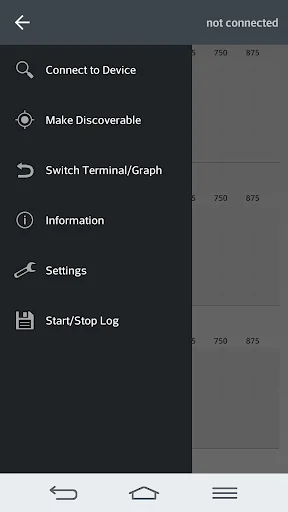
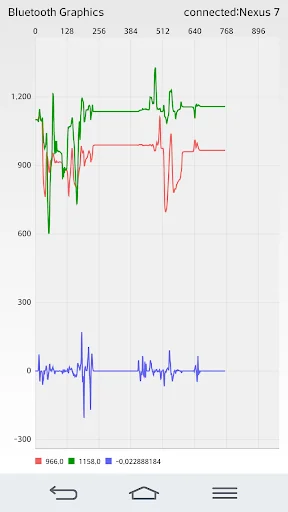
What the app looks like
Live screenshots from the Play Store, captured by our snapshot worker. Tap any image to enlarge.
Bluetooth Terminal/Graphics's revenue trajectory
Forecast revenue from snapshot history. Last 1 months.
Where Bluetooth Terminal/Graphics sits in Tools
Revenue distribution of 77129 comparable apps. Bluetooth Terminal/Graphics highlighted.
Bluetooth Terminal/Graphics vs comparable apps
Revenue trajectory side-by-side. Bold = Bluetooth Terminal/Graphics, ghosted = peers.
App spec
Version
2.09
Last update
Apr 19, 2026
Launched
Aug 11, 2013
Price
Free
Monetization
Free
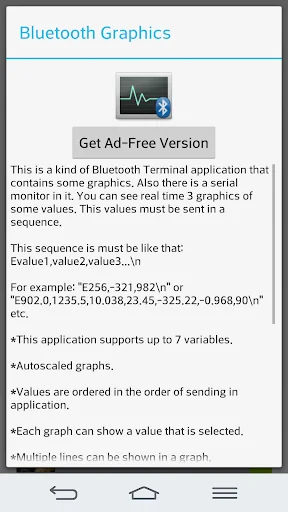
What Bluetooth Terminal/Graphics actually does (from store listing)
This is a kind of Bluetooth Terminal application that contains some graphics.
Also there is a serial monitor in it.
You can use this app with Arduino or another microcontroller for your robotics projects and etc.
You can see real time 3 graphics of some values.
This values must be sent in a sequence.
This sequence must be like that: Evalue1,value2,value3...\n
For example: "E256,-321,982\n" or "E902,1235,10,23,-325,-1240,90\n" etc.
***In Full version, you can see 7 graphs and there a…
This is a kind of Bluetooth Terminal application that contains some graphics.
Also there is a serial monitor in it.
You can use this app with Arduino or another microcontroller for your robotics projects and etc.
You can see real time 3 graphics of some values.
This values must be sent in a sequence.
This sequence must be like that: Evalue1,value2,value3...\n
For example: "E256,-321,982\n" or "E902,1235,10,23,-325,-1240,90\n" etc.
***In Full version, you can see 7 graphs and there are no ads***
Warning: Do not send data too much frequently. If there is lag and freezing in the app when there is data traffic, decrease incoming data frequency.
*This application supports up to 7 variables.
*You can set graphics' maximum and minimum values.
*Autoscaled graphs.
*Values are ordered in the order of sending in application.
*Each graph can show a value that is selected.
*You can set number of graphics that is shown.
*Multiple lines can be shown in a graph.
*Pinch to zoom both axes in graphs.
*Sliding and refreshing graphs.
*Data logs can be saved at *ExternalStorage*/BluetoothGraphics/*CurrentTime* directory
*Up to 7 lines in multiple line graph for Full version
MPAndroidChart library is used.
Arduino usage example for serial printing part for 2 values (adc1 and adc2 are example variables):
...
Serial.print("E");
Serial.print(adc1);
Serial.print(",");
Serial.print(adc2);
Serial.print("\n");
...
Coming Soon: USB Serial Communication Support for Full version
For full application: BT Terminal/Graphics Full
Note: If you want a full apk of this application, you can send mail to me. Also, I can make a custom GUI for your projects or works.
Comparable Android apps
The five apps in Tools with the closest revenue to Bluetooth Terminal/Graphics. Click any to see its detail page.
Each forecast combines App Store rating, ratings count, monetisation model, pricing tier, IAP signals and ad-supported flag.
The base estimate is then multiplied by a per-category scaling factor learned from apps with founder-verified MRR.
Every number on this page comes from public APIs and bumetric's own snapshot history.
Full methodology covers input variables, accuracy bands per category and how we treat apps without comparable anchors.
See also the live data on Bluetooth Terminal/Graphics's tracker page for current rating, reviews and snapshot timeline.
Building something similar? Get a free AI audit with $-revenue forecasts for every recommendation.

 Peace of Mind+
 Flash Alerts on Call and SMS
 China Train Booking
 Phone 13 home bar
 Access.Run