Managing your finances has never been so simple and intuitive. The BNL app offers you complete control over your current accounts and cards, with a renewed design and a user experience designed for your daily life. Log in quickly with Fingerprint and start simplifying your life.
What can you do with the BNL app?
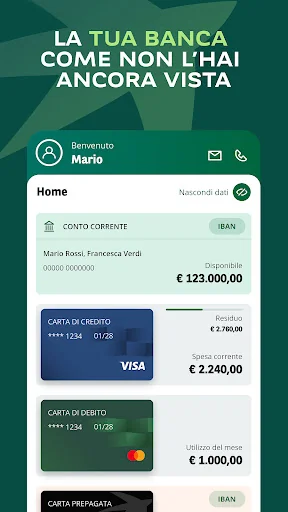
• Purchases and Card Management: Purchase the BNL Classic Credit Card and BNL Prepaid Card directly in the app. View the credit limit of all your cards, including shared ones.
• Pay…
Managing your finances has never been so simple and intuitive. The BNL app offers you complete control over your current accounts and cards, with a renewed design and a user experience designed for your daily life. Log in quickly with Fingerprint and start simplifying your life.
What can you do with the BNL app?
• Purchases and Card Management: Purchase the BNL Classic Credit Card and BNL Prepaid Card directly in the app. View the credit limit of all your cards, including shared ones.
• Payments and Transactions: Make instant and ordinary Italian and Sepa transfers, account transfers, mobile phone and prepaid card top-ups. Pay postal bills, including via camera, and MAV/RAV.
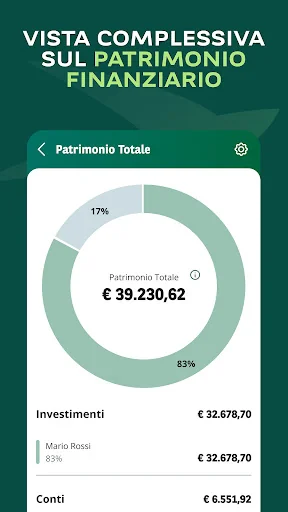
• View your overall assets: If you have a Securities Deposit, you can view your overall assets, divided by liquidity in current accounts and invested capital.
• Consult the documents sent by the Bank, directly in the app, in the “Doc” section
We are constantly evolving to offer you new features. Don't miss the updates!
For assistance, write to: centro_relazioni_clientela@bnlmail.com
The accessibility declaration based on the provisions of Legislative Decree 76/2020 is available at the following address:
https://bnl.it/it/Footer/dichiarazione-di-accessibilita-app
Comparable Android apps
The five apps in Finance with the closest revenue to BNL. Click any to see its detail page.
Each forecast combines App Store rating, ratings count, monetisation model, pricing tier, IAP signals and ad-supported flag.
The base estimate is then multiplied by a per-category scaling factor learned from apps with founder-verified MRR.
Every number on this page comes from public APIs and bumetric's own snapshot history.
Full methodology covers input variables, accuracy bands per category and how we treat apps without comparable anchors.
See also the live data on BNL's tracker page for current rating, reviews and snapshot timeline.
Building something similar? Get a free AI audit with $-revenue forecasts for every recommendation.


 WPCU Mobile Banking
 OLD Raiffeisen Online
 Zenmoney: expense tracker
 Qapital: The Money Saving App
 i-Invest iPru