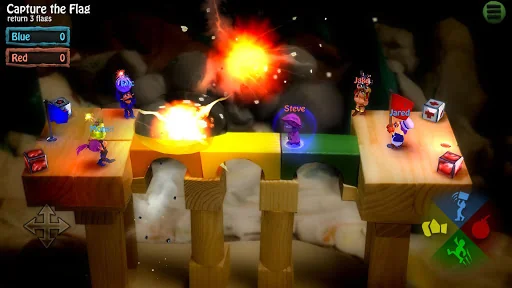
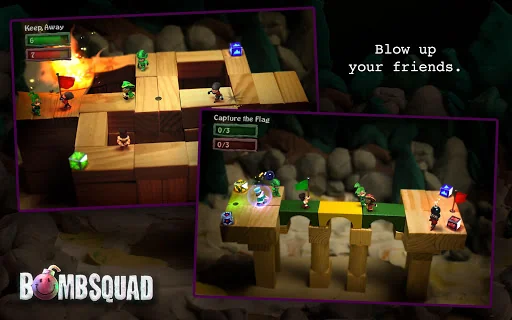
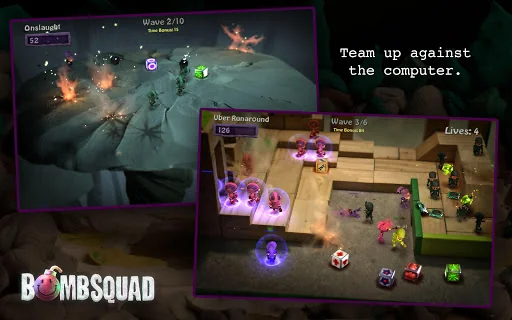
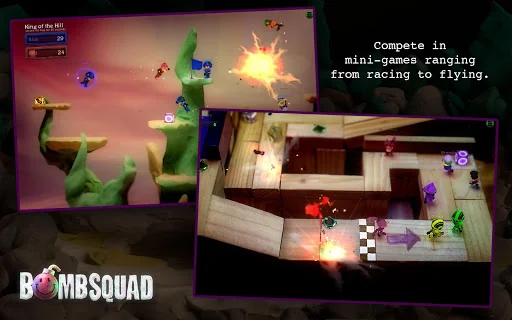
Blow up your friends in mini-games ranging from capture-the-flag to hockey! Featuring 8 player local/networked multiplayer, gratuitous explosions, advanced ragdoll face-plant physics, pirates, ninjas, barbarians, insane chefs, and more.
BombSquad supports touch screens as well as a variety of controllers so all your friends can get in on the action.
You can even use phones and tablets as controllers via the free 'BombSquad Remote' app.
Bombs away!
Android TV users: a compatible gamepad…
Blow up your friends in mini-games ranging from capture-the-flag to hockey! Featuring 8 player local/networked multiplayer, gratuitous explosions, advanced ragdoll face-plant physics, pirates, ninjas, barbarians, insane chefs, and more.
BombSquad supports touch screens as well as a variety of controllers so all your friends can get in on the action.
You can even use phones and tablets as controllers via the free 'BombSquad Remote' app.
Bombs away!
Android TV users: a compatible gamepad is required to play (or a phone/tablet running the 'BombSquad Remote' app)
Comparable Android apps
The five apps in Action with the closest revenue to BombSquad. Click any to see its detail page.
Each forecast combines App Store rating, ratings count, monetisation model, pricing tier, IAP signals and ad-supported flag.
The base estimate is then multiplied by a per-category scaling factor learned from apps with founder-verified MRR.
Every number on this page comes from public APIs and bumetric's own snapshot history.
Full methodology covers input variables, accuracy bands per category and how we treat apps without comparable anchors.
See also the live data on BombSquad's tracker page for current rating, reviews and snapshot timeline.
Building something similar? Get a free AI audit with $-revenue forecasts for every recommendation.

 Miraculous Ladybug & Cat Noir
 Bed Wars
 Stickman Warriors
 Nebulous.io
 Tasty Planet