<b>TUTORIALS</b>
https://youtube.com/playlist?list=PLUskUU-NvGqjXl4yDvHkQj9ssV1BMySMm
<b>TROUBLESHOOTING</b>
https://julietapp.blogspot.com/p/troubleshooting-general.html
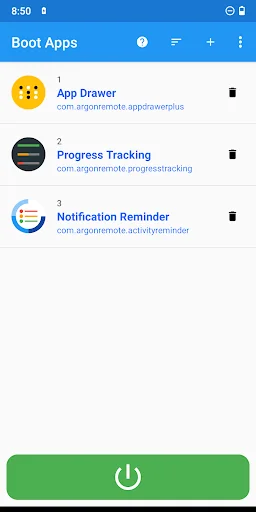
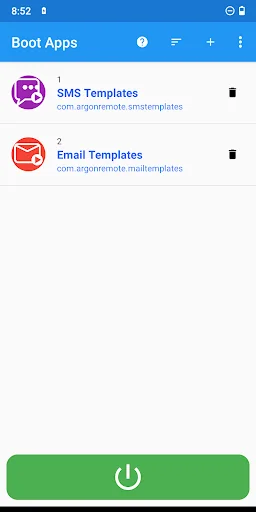
This app allows you to manage a list of apps to open automatically at startup (when you turn on or restart your smartphone).
<b>NOTES</b>
• The apps will not be opened immediately but when the system is ready
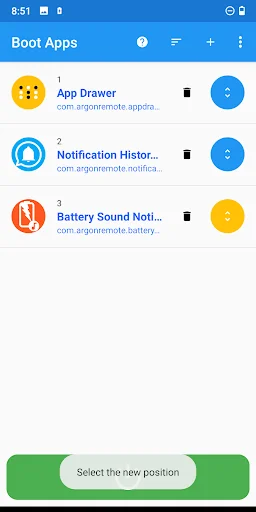
• The selected apps will be opened automatically and brought to the foreground
<b>FEATURES AND BENEFITS<…
This app allows you to manage a list of apps to open automatically at startup (when you turn on or restart your smartphone).
NOTES • The apps will not be opened immediately but when the system is ready
• The selected apps will be opened automatically and brought to the foreground
FEATURES AND BENEFITS • No root
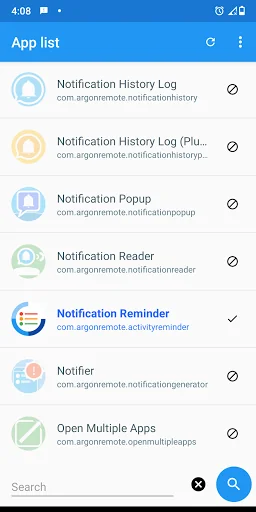
• Ability to open multiple apps
• Ability to set app startup order
• Startup app manager
• Easy to use
Comparable Android apps
The five apps in Productivity with the closest revenue to Boot Apps. Click any to see its detail page.
Each forecast combines App Store rating, ratings count, monetisation model, pricing tier, IAP signals and ad-supported flag.
The base estimate is then multiplied by a per-category scaling factor learned from apps with founder-verified MRR.
Every number on this page comes from public APIs and bumetric's own snapshot history.
Full methodology covers input variables, accuracy bands per category and how we treat apps without comparable anchors.
See also the live data on Boot Apps's tracker page for current rating, reviews and snapshot timeline.
Building something similar? Get a free AI audit with $-revenue forecasts for every recommendation.

 iProfi
 용돈 기입장
 Talixo Driver
 Galcon BT
 Add-On: Nokia