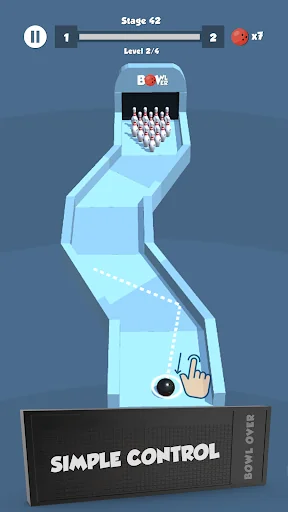
BOWL OVER is a CASUAL MINI BOWLING GAME with challenging levels.
Aim, shoot and knock down all of the pins. Move forward through the levels. Complete the stages with given balls. Become expert level by level. Enjoy stunning visual effects and addictive gameplay mechanics.
GAME FEATURES
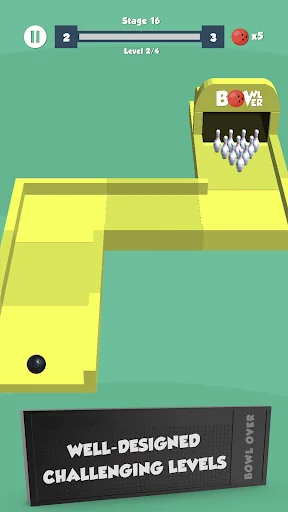
Well-designed challenging levels
Simple, one-finger control
Special balls as boosters
Numerous combinations of lanes
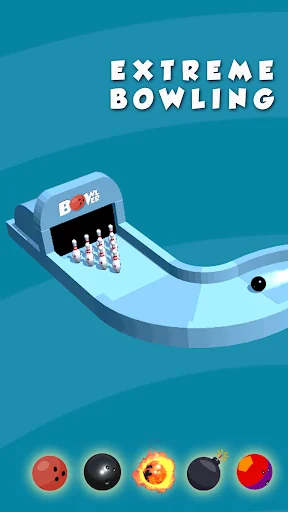
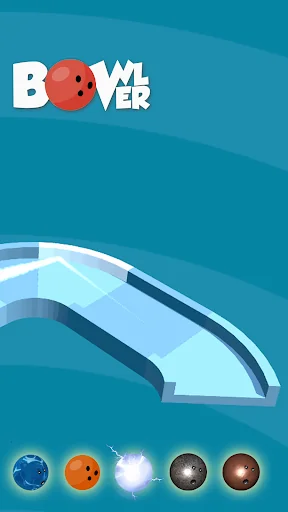
Various ball skins
Ten-pin bowling rules and physics
In-game bonuses
Revive af…
BOWL OVER is a CASUAL MINI BOWLING GAME with challenging levels.
Aim, shoot and knock down all of the pins. Move forward through the levels. Complete the stages with given balls. Become expert level by level. Enjoy stunning visual effects and addictive gameplay mechanics.
GAME FEATURES
Well-designed challenging levels
Simple, one-finger control
Special balls as boosters
Numerous combinations of lanes
Various ball skins
Ten-pin bowling rules and physics
In-game bonuses
Revive after fail
Classy background music and cool sound effects
Autosaved progress, continue playing where you left off
Polished with satisfying and stimulating visual effects
HOW TO PLAY
Drag, aim and release the ball.
Try to knock down all of the pins.
Try to finish all levels of a stage with the given number of balls.
Attention, this game may BOWL you OVER.
Comparable Android apps
The five apps in Arcade with the closest revenue to Bowl Over. Click any to see its detail page.
Each forecast combines App Store rating, ratings count, monetisation model, pricing tier, IAP signals and ad-supported flag.
The base estimate is then multiplied by a per-category scaling factor learned from apps with founder-verified MRR.
Every number on this page comes from public APIs and bumetric's own snapshot history.
Full methodology covers input variables, accuracy bands per category and how we treat apps without comparable anchors.
See also the live data on Bowl Over's tracker page for current rating, reviews and snapshot timeline.
Building something similar? Get a free AI audit with $-revenue forecasts for every recommendation.
 Uplift
 Boxes Drop - Tower block
 OpenLiero
 Ninja Birds: Ninja Games
 弾幕の檻
弾幕の檻