What Box It Up! Inc. actually does (from store listing)
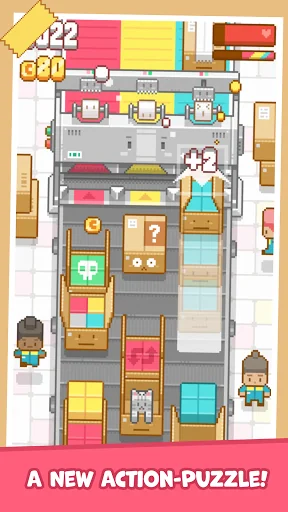
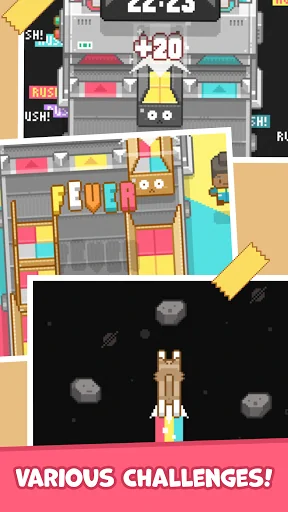
From the creator of Tape it Up!, a unique action-puzzle game has arrived! You need to pack the boxes up ASAP! How far can you go with these messy boxes?
- Super simple swipe & tap controls
- Sweet & stylish pixel art
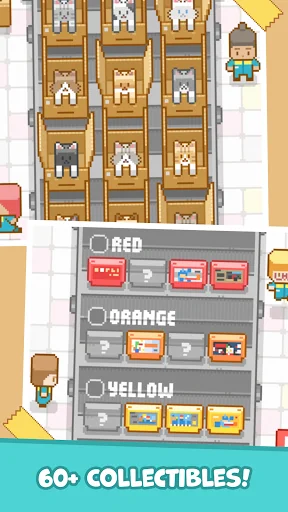
- 20+ Skins & 60+ Collectibles
- No internet connection required to play
- Easy to play, but hard to master
Terms of Service
https://team-tape.com/boxitup/terms-of-service.html
Privacy Policy
https://team-tape.com/boxitup/privacy-policy.html
Help and Support
conta…
From the creator of Tape it Up!, a unique action-puzzle game has arrived! You need to pack the boxes up ASAP! How far can you go with these messy boxes?
- Super simple swipe & tap controls
- Sweet & stylish pixel art
- 20+ Skins & 60+ Collectibles
- No internet connection required to play
- Easy to play, but hard to master
Terms of Service
https://team-tape.com/boxitup/terms-of-service.html
Each forecast combines App Store rating, ratings count, monetisation model, pricing tier, IAP signals and ad-supported flag.
The base estimate is then multiplied by a per-category scaling factor learned from apps with founder-verified MRR.
Every number on this page comes from public APIs and bumetric's own snapshot history.
Full methodology covers input variables, accuracy bands per category and how we treat apps without comparable anchors.
See also the live data on Box It Up! Inc.'s tracker page for current rating, reviews and snapshot timeline.
Building something similar? Get a free AI audit with $-revenue forecasts for every recommendation.


 Space Shooter
 Frosty Ball 3D
 Reflex Hero
 Forest Trip
 Supergun