What Breakout Stocks: Chart & Level actually does (from store listing)
Breakout Stocks app provides breakout chart and level analysis for all intraday or positional Indian stock market traders.
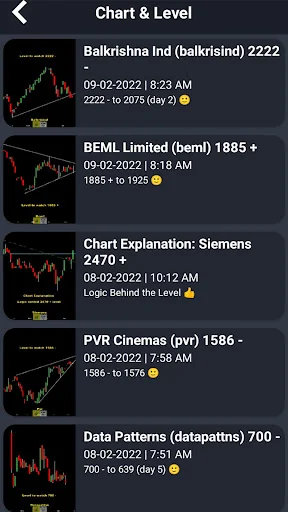
Our top Breakout Stocks chart and level selection is based on technical analysis, candlestick patterns, support, resistance, and trendline. Above all, price action is in the leading role behind our study.
All are manually one-by-one scanned breakout stocks. No - paid indicators, online scanner from chartink or tradingview, software system, screener, hidden strategies, …
Breakout Stocks app provides breakout chart and level analysis for all intraday or positional Indian stock market traders.
Our top Breakout Stocks chart and level selection is based on technical analysis, candlestick patterns, support, resistance, and trendline. Above all, price action is in the leading role behind our study.
All are manually one-by-one scanned breakout stocks. No - paid indicators, online scanner from chartink or tradingview, software system, screener, hidden strategies, etc are used.
Daily, weekly, and monthly levels help you in today's or tomorrow's trading. It will be useful for your positional or intraday trading. We usually publish breakout trading levels of equity stocks, Nifty, Bank Nifty, Sensex, Gold, etc.
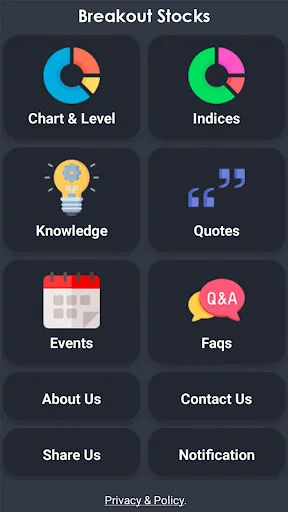
Main Sections in the Breakout Stock App:
Chart & Level: equity breakout stock analysis.
Indices: Nifty 50, Nifty Bank, Gold, etc. Index related analysis.
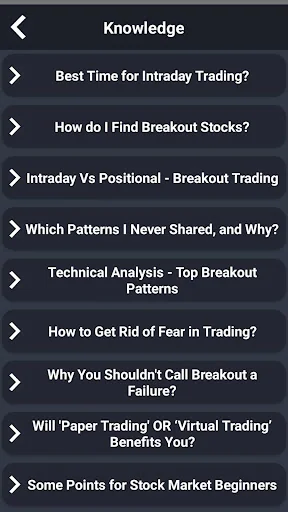
Knowledge: list of articles to gain stock market information.
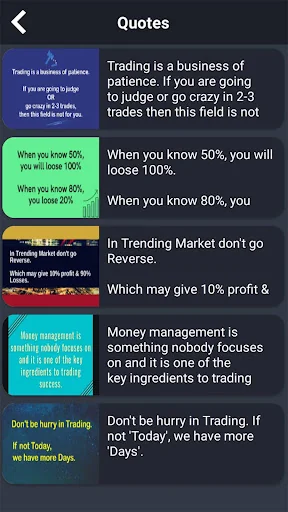
Quotes: motivational quotes with images.
Events: important upcoming events of the Indian stock market.
FAQs: frequently asked questions list.
Notification: list of recently sent notifications.
The application is created by an individual trader for the Indian stock market traders to show analysis. Technical analysis is such an advanced method that it many times shows us the next move but after all, it depends on an identifier's chart reading skill.
There is no paid charge. It does not offer any live price data or alert updates. All available information is for study purpose only and not a buy-and-sell recommendation. Please seek the help of your financial advisor before investing in any stock.
Why we created the Breakout Stocks app?
We have many followers on the social media platforms including facebook page, twitter handle, and telegram channel. Some people are intentionally sending commercial messages to our followers.
There were complaints from various users. So we decided to make an app where there is no problem and respect the privacy of all. I will try to add more features in upcoming major updates.
Thanks,
Piyush Patel.
Comparable Android apps
The five apps in Finance with the closest revenue to Breakout Stocks: Chart & Level. Click any to see its detail page.
Each forecast combines App Store rating, ratings count, monetisation model, pricing tier, IAP signals and ad-supported flag.
The base estimate is then multiplied by a per-category scaling factor learned from apps with founder-verified MRR.
Every number on this page comes from public APIs and bumetric's own snapshot history.
Full methodology covers input variables, accuracy bands per category and how we treat apps without comparable anchors.
See also the live data on Breakout Stocks: Chart & Level's tracker page for current rating, reviews and snapshot timeline.
Building something similar? Get a free AI audit with $-revenue forecasts for every recommendation.

 LK-Pay
 Q Mobile Banking
 Cactvs
 Wescom Financial Mobile
 Taxealo