What Bricks N Heroes actually does (from store listing)
📣📣📣 <b>Brave hero~! Save the princesses!</b> 📣📣📣
A fearsome <b>Bricks Dragon</b> appeared and kidnapped all the princesses of the Empire. It is said that the princesses have been scattered to a mysterious land that they have never been to, and are guarded by the evil men of the dragon.
Because it is a dangerous and difficult road, only you who are wise and courageous can save the princess! Help~
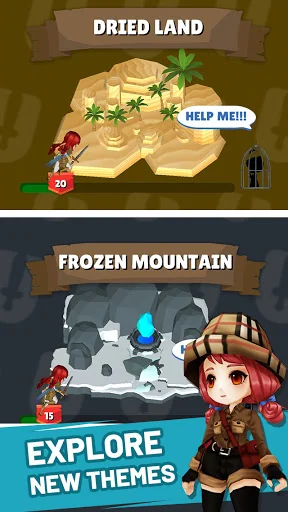
Welcome to the endless adventure fantasy world of Bricks!
The monsters' tough counterattack…
A fearsome Bricks Dragon appeared and kidnapped all the princesses of the Empire. It is said that the princesses have been scattered to a mysterious land that they have never been to, and are guarded by the evil men of the dragon.
Because it is a dangerous and difficult road, only you who are wise and courageous can save the princess! Help~
Welcome to the endless adventure fantasy world of Bricks!
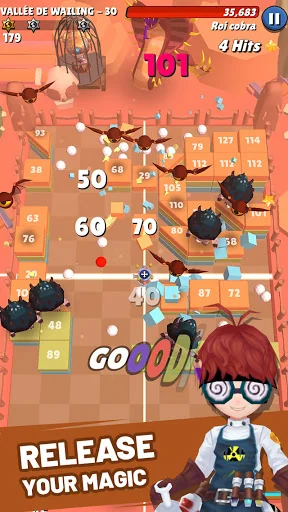
The monsters' tough counterattack begins. Keep attacking their weaknesses with cool skills. The bricks that are firmly stacked will collapse at once. And don't forget, if you meet the monster's boss, one of you must die... .
👍👍Good luck!👍👍
How to play 💬 Fire the ball by touching the screen.
💬 Clear the stage by removing bricks from the field.
💬 If possible, remove the bricks the monster is burning on first.
💬 Break the bricks and avoid hitting the floor.
💬 Find the best location and angle to hit all the bricks.
💬 Breaking bricks can cause damage to monsters.
💬 Meet tons of heroes and minions and join them in battle.
Feature 🔹 Free to play
🔹 Tons of stages
🔹 Various heroes and minions
🔹 Easy to play, Simplest game system, Designed for one handheld gameplay.
🔹 Off-line (without internet connection) gameplay supported
🔹 Tablet device supported
🔹 Achievement & Leaderboard supported
Each forecast combines App Store rating, ratings count, monetisation model, pricing tier, IAP signals and ad-supported flag.
The base estimate is then multiplied by a per-category scaling factor learned from apps with founder-verified MRR.
Every number on this page comes from public APIs and bumetric's own snapshot history.
Full methodology covers input variables, accuracy bands per category and how we treat apps without comparable anchors.
See also the live data on Bricks N Heroes's tracker page for current rating, reviews and snapshot timeline.
Building something similar? Get a free AI audit with $-revenue forecasts for every recommendation.


 Xpectroid ZX Spectrum Emulator
 Crowd Town
 Room and a Half 2
 Spikey's Bounce Around
 Car repair