What Brightmile actually does (from store listing)
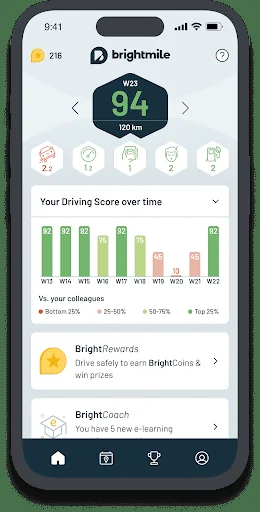
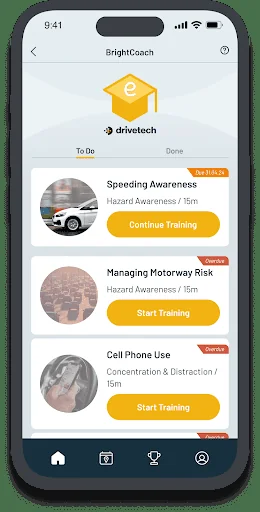
Brightmile is an innovative driver safety solution- our primary goal is to get you the driver home safely at the end of each day.
We hope that you will enjoy using Brightmile - we have tried to build you an app that is:
Rewarding - drive safely to win raffle prizes, bragging rights, and more via our 'bright rewards' programme!
Non-intrusive - your driving behaviour will only be communicated to your company in respect of business driving, your location is never reported, and you have ult…
Brightmile is an innovative driver safety solution- our primary goal is to get you the driver home safely at the end of each day.
We hope that you will enjoy using Brightmile - we have tried to build you an app that is:
Rewarding - drive safely to win raffle prizes, bragging rights, and more via our 'bright rewards' programme!
Non-intrusive - your driving behaviour will only be communicated to your company in respect of business driving, your location is never reported, and you have ultimate control over your data.
Useful - for example our mileage expensing assistant saving you time and hassle if you currently do this manually.
Collaborative - please get in touch with us at any time to share your thoughts and feedback.
The Brightmile team are continually adding new features so to ensure you don’t miss out please ensure your app is set to auto update so you are always updated to the latest version available on the Google Play Store.
Comparable Android apps
The five apps in Auto & Vehicles with the closest revenue to Brightmile. Click any to see its detail page.
Each forecast combines App Store rating, ratings count, monetisation model, pricing tier, IAP signals and ad-supported flag.
The base estimate is then multiplied by a per-category scaling factor learned from apps with founder-verified MRR.
Every number on this page comes from public APIs and Bumetric's own snapshot history.
Full methodology covers input variables, accuracy bands per category and how we treat apps without comparable anchors.
See also the live data on Brightmile's tracker page for current rating, reviews and snapshot timeline.
Building something similar? Get a free AI audit with $-revenue forecasts for every recommendation.




 EV Edge
 Trella: Shipper
 Chargepoint App
 Das WeltAuto Valuator
 Parklio