Live screenshots from the App Store, captured by our snapshot worker. Tap any image to enlarge.
Our Experts shop Top stores: Amazon, Best Buy, Home Depot, Target, Walmart etc and Find You the Best Deals, *EVERYDAY*
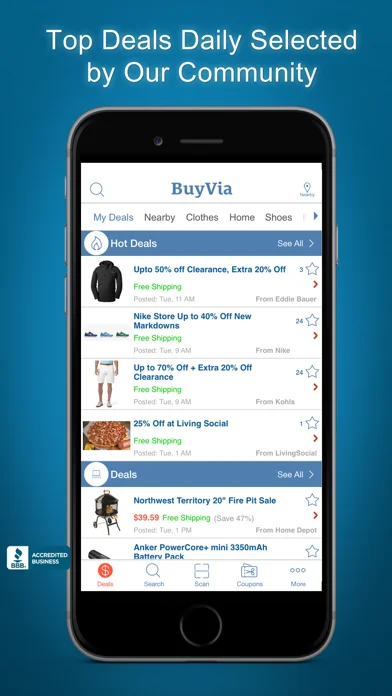
Local Coupons, Barcode Scanner, Limited time Deals, Download BuyVia NOW!
"This app, Buy Via, is phenomenal!" - The Today Show
As seen in NY Times, Washington Post, CNN, Forbes, TechCrunch, and USA Today.
“Finally, an app that saves me time AND money– with BuyVia’s alerts I saved $100 on an iPad.” - Lance
BuyVia was founded by Professional Shopper Norman Fong. Creator of the…
Read full description →
Our Experts shop Top stores: Amazon, Best Buy, Home Depot, Target, Walmart etc and Find You the Best Deals, *EVERYDAY*
Local Coupons, Barcode Scanner, Limited time Deals, Download BuyVia NOW!
"This app, Buy Via, is phenomenal!" - The Today Show
As seen in NY Times, Washington Post, CNN, Forbes, TechCrunch, and USA Today.
“Finally, an app that saves me time AND money– with BuyVia’s alerts I saved $100 on an iPad.” - Lance
BuyVia was founded by Professional Shopper Norman Fong. Creator of the first deal site, Techbargains.
We shop the best deals from leading stores including Amazon discounts, Best Buy, Burger King, Dell coupons, Home Depot, Kohls, Lowe's, Macys, Newegg, Nordstrom, Old Navy, Staples, Starbucks, Target, Walmart, and many others. Never miss a hot deal again.
Local Stores include: H&M, JoAnn Fabric, Michael's, Walmart, Target, Staples, Nordstrom, Macy's, Home Depot, Best Buy, and more
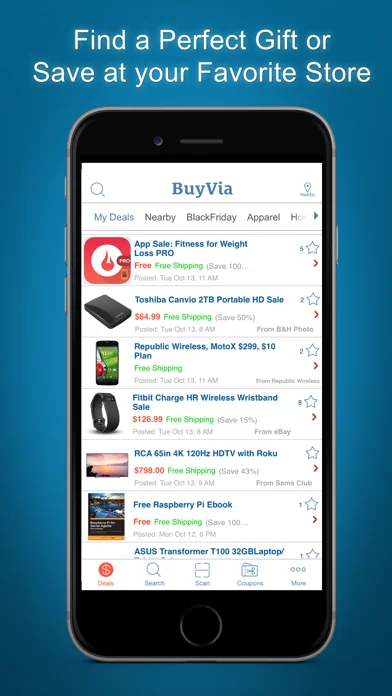
You’ll find slick deals and can compare prices on apparel, home items, shoes, tablets, laptops, TV’s, Smartphones deals, and more.
FIND LOWEST PRICES
BuyVia helps you find the lowest prices on products from both online and local stores, it also aggregates all of your favorite deal sites in one place so you can compare prices. UPC Barcode scanner, QR code, and search function allow you to find the lowest price. BuyVia app/website lets you securely purchase products or save your searches for later shopping.
RECEIVE ALERTS WHEN PRICES FALL
Set a shopping alert to receive a push notification or email when sales occur, whether the deal is online or local. Excludes amazon.
FEATURES:
•Find lowest price from online and local retailers, by name or Part Number; database has millions of products
•Scan UPC barcodes/QR to look find best prices or to save items to your shopping list
•Alerts when products go on sale (Excludes Amazon)
•Shop Securely with SSL encryption
•Automatically enter store logins with password manager Integration.
•Find local coupons, printable coupons and deals for nearby stores
•Synchronize shopping lists, preferences, and alerts on all devices
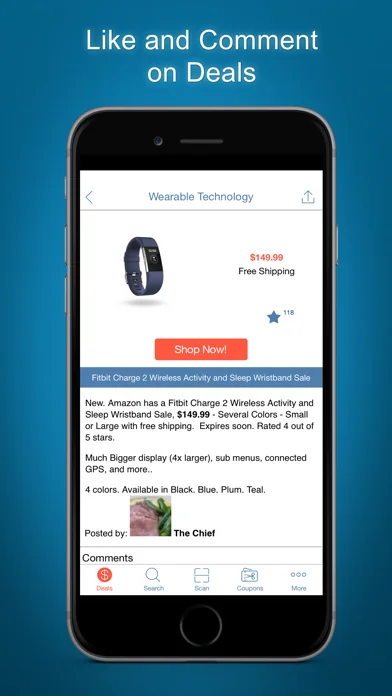
•Share deals via Twitter, FaceBook, email, and text
•Supports the latest iPhones, iPads, and iOS; and on the web at BuyVia.com
We value feedback! If you have an issue with the app, do not leave a review, immediately contact us at:
www.BuyVia.com
@buyvia
Facebook.com/BuyVia
BuyVia (R) is a registered trademark of BuyVia, LLC
===
AD FREE SUBSCRIPTION
- You will receive access to an Ad Free version of this app for the duration of the subscription.
- Subscription length: Monthly or Annually
- Payments will be charged to iTunes Account at confirmation of purchase.
- Your account will be charged for renewal within 24-hours prior to the end of the current period and identify the cost of the renewal.
- Subscriptions may be managed by the user and auto-renewal may be turned off by going to the user's Account Settings after purchase.
- All prices are subject to change without notification. We occasionally run promotion prices as incentives or limited time opportunities for qualifying purchases made during the promotional time period. Due to the time sensitive and promotional nature of these events, we are unable to offer price protection or retroactive discounts or refunds for previous purchases in the event of a price reduction or promotional offering.
If you want to cancel a subscription: http://support.apple.com/kb/ht4098
Privacy Policy: https://www.buyvia.com/mobile/app-privacy.php
Terms of Use: https://www.apple.com/legal/internet-services/itunes/dev/stdeula/
The five apps in Shopping with the closest revenue to BuyVia Price Comparison. Click any to see its detail page.
Each forecast combines App Store rating, ratings count, monetisation model, pricing tier, IAP signals and ad-supported flag.
The base estimate is then multiplied by a per-category scaling factor learned from apps with founder-verified MRR.
Every number on this page comes from public APIs and bumetric's own snapshot history.

 T.J.Maxx
 MESHKI U.S
 AYBL
AYBL
 Windsor Store
 CityMart.