1.2M Assets Tracked Updated 1 min ago Revenue Forecasts
Add an app Create Account Sign In
Home
CGR Cinémas icon

How much does CGR Cinémas earn?

Android app from The BoxOffice Company France · Entertainment

ML forecast ★ 4.0 · 21K → Stable Free

~1.3K/mo

ML revenue forecast. Calibrated against 77127 apps in this category.

Confidence band
±15%
High — many comparable apps with verified data

At a glance

What the app looks like

Live screenshots from the Play Store, captured by our snapshot worker. Tap any image to enlarge.

CGR Cinémas screenshot 1 CGR Cinémas screenshot 2 CGR Cinémas screenshot 3 CGR Cinémas screenshot 4

CGR Cinémas's revenue trajectory

Forecast revenue from snapshot history. Last 2 months.

Where CGR Cinémas sits in Entertainment

Revenue distribution of 77127 comparable apps. CGR Cinémas highlighted.

CGR Cinémas vs comparable apps

Revenue trajectory side-by-side. Bold = CGR Cinémas, ghosted = peers.

App spec

Version
6.2.7
Last update
Jun 05, 2026
Launched
Jul 18, 2018
Price
Free
Monetization
Free

What CGR Cinémas actually does (from store listing)

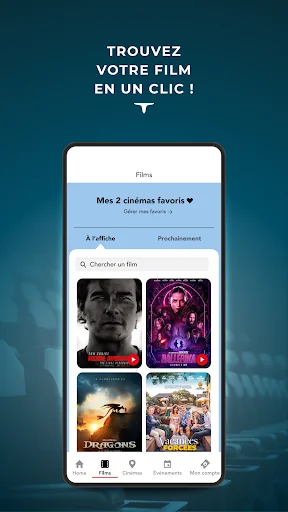
Find all the information about your cinema and buy your tickets! 
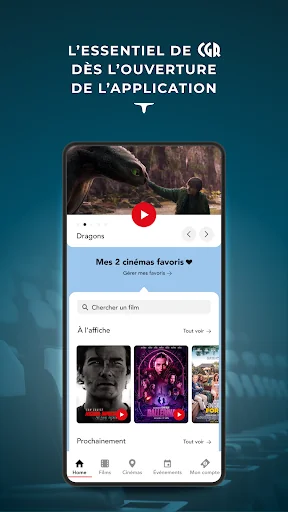
Find all the information about your CGR cinema at any time and buy your tickets directly on your Smartphone! 
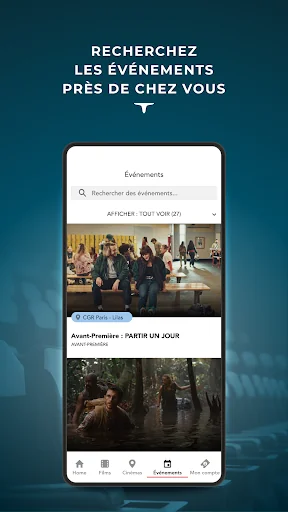
Discover the films on show, all your screenings, upcoming films but also the events at your cinema (premieres, concerts, shows, special events, etc.) BUY YOUR PLACES FROM THE APPLICATION - A simplified and secure purchase - Your tickets stored directly on your smartphone
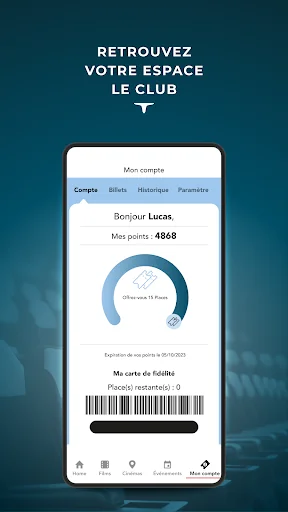
 THE CGR CLUB …
Read full description →

Comparable Android apps

The five apps in Entertainment with the closest revenue to CGR Cinémas. Click any to see its detail page.

AppRevenueRatingRatings
Dance Yourself – video face icon Dance Yourself – video face 1.3K ★ 4.2 20K
TV Guide icon TV Guide 1.3K ★ 4.3 67K
Harpal Geo icon Harpal Geo 1.3K ★ 3.7 23K
AzamTV Max icon AzamTV Max 1.3K ★ 3.7 23K
Watch TNT icon Watch TNT 1.3K ★ 2.1 38K
Own CGR Cinémas? Replace our estimate with your real revenue via Stripe Connect or ASC. Get a public Verified badge.
Claim & verify →

How we calculated this

Each forecast combines App Store rating, ratings count, monetisation model, pricing tier, IAP signals and ad-supported flag. The base estimate is then multiplied by a per-category scaling factor learned from apps with founder-verified MRR. Every number on this page comes from public APIs and bumetric's own snapshot history.

Full methodology covers input variables, accuracy bands per category and how we treat apps without comparable anchors. See also the live data on CGR Cinémas's tracker page for current rating, reviews and snapshot timeline.

Building something similar? Get a free AI audit with $-revenue forecasts for every recommendation.
Audit my app →