What Chiefs Mobile actually does (from store listing)
Chiefs Mobile is the official app of the Kansas City Chiefs. Chiefs Mobile keeps you connected to the Chiefs Kingdom 365 days a year with team news, updated rosters, stats and injury reports. Enhance your game day experience with mobile ticketing, in-stadium messaging, in-app 50/50 ticket purchasing and more!
Features include:
- Live Stream Chiefs Games (in-market)
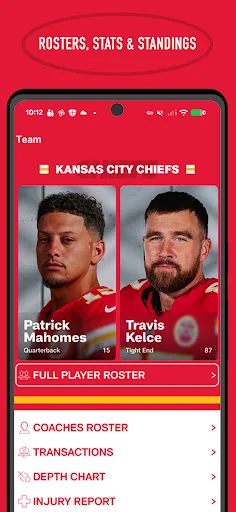
- Team Roster, Player Bios, Depth Chart & Injury Report
- Game, Team and Player Stats
- League and Conference Standin…
Chiefs Mobile is the official app of the Kansas City Chiefs. Chiefs Mobile keeps you connected to the Chiefs Kingdom 365 days a year with team news, updated rosters, stats and injury reports. Enhance your game day experience with mobile ticketing, in-stadium messaging, in-app 50/50 ticket purchasing and more!
Features include:
- Live Stream Chiefs Games (in-market)
- Team Roster, Player Bios, Depth Chart & Injury Report
- Game, Team and Player Stats
- League and Conference Standings
- Full Game Schedule
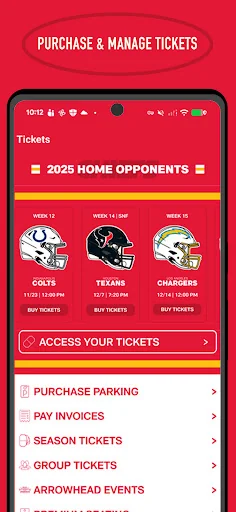
- Purchase Tickets & Parking
- Access your mobile tickets
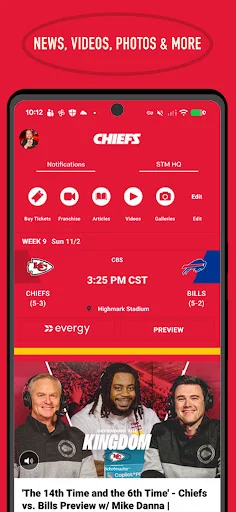
- Latest News, Videos, Photos and Podcasts
- Chiefs Cheerleaders
- Arrowhead Stadium Information: Interactive Amenities Map, Problem Reporting, Parking Information and more.
Please note: This app features Nielsen's proprietary measurement software which contributes to market research, like Nielsen's TV Ratings. Please see https://priv-policy.imrworldwide.com/priv/mobile/us/en/optout.html for more information.
Comparable Android apps
The five apps in Sports with the closest revenue to Chiefs Mobile. Click any to see its detail page.
Each forecast combines App Store rating, ratings count, monetisation model, pricing tier, IAP signals and ad-supported flag.
The base estimate is then multiplied by a per-category scaling factor learned from apps with founder-verified MRR.
Every number on this page comes from public APIs and bumetric's own snapshot history.
Full methodology covers input variables, accuracy bands per category and how we treat apps without comparable anchors.
See also the live data on Chiefs Mobile's tracker page for current rating, reviews and snapshot timeline.
Building something similar? Get a free AI audit with $-revenue forecasts for every recommendation.

 Live Tennis Rankings / LTR
 Soccer Ping-Pong
 Swipe Basketball
 Botola
 Socios.com - Wallet & Tokens