Never have chores been this much fun to do. Who wants to actually get dirty doing busy work that no one wants to do? For once you will actually want to do the cleaning.
This game is not what you would expect. This is not some generic cleaning game. Each different chore will test your skills. Find the right matching sock, time your pour correctly to get the cereal in the bowl. So many unique chores testing your abilities to get the job done right!
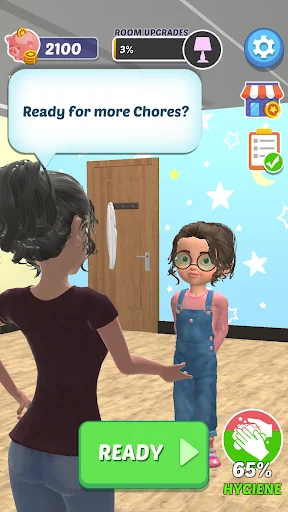
Let's show Mom how good you are at doing al…
Never have chores been this much fun to do. Who wants to actually get dirty doing busy work that no one wants to do? For once you will actually want to do the cleaning.
This game is not what you would expect. This is not some generic cleaning game. Each different chore will test your skills. Find the right matching sock, time your pour correctly to get the cereal in the bowl. So many unique chores testing your abilities to get the job done right!
Let's show Mom how good you are at doing all the house chores.She will be so proud!
Game Features:
1. Simple but addicting mechanics
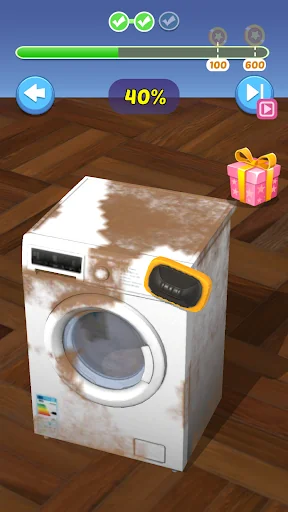
Swipe to clean or drag to match. Simple but addicting mechanics will keep you addicted
2. Beautiful Graphics
So lifelike it’s as if you were actually cleaning up real messes
3. New Game Modes constantly getting added
Never go bored in this game with rotating chores constantly getting added
4. Chill and have fun
Chores and Chill - it’s what every cool kid is doing this weekend.
Whether you are like ironing, cleaning, washing, mowing, raking, tidying or just don’t like seeing a dirty toilet, than Chores is the game for you!
Visit https://lionstudios.cc/contact-us/ if have any feedback, need help on beating a level or have any awesome ideas you would like to see in the game!
From the Studio that brought you Mr. Bullet, Happy Glass, Ink Inc and Love Balls!
Follow us to get news and updates on our other Award Winning titles;
https://lionstudios.cc/
Facebook.com/LionStudios.cc
Instagram.com/LionStudioscc
Twitter.com/LionStudiosCC
Youtube.com/c/LionStudiosCC
Comparable Android apps
The five apps in Casual with the closest revenue to Chores!. Click any to see its detail page.
Each forecast combines App Store rating, ratings count, monetisation model, pricing tier, IAP signals and ad-supported flag.
The base estimate is then multiplied by a per-category scaling factor learned from apps with founder-verified MRR.
Every number on this page comes from public APIs and bumetric's own snapshot history.
Full methodology covers input variables, accuracy bands per category and how we treat apps without comparable anchors.
See also the live data on Chores!'s tracker page for current rating, reviews and snapshot timeline.
Building something similar? Get a free AI audit with $-revenue forecasts for every recommendation.


 Dropping Ball
 Wonka's World of Candy Match 3
 Frippa Games for Girls
 Happy Street
 Shark Evolution: Idle Game