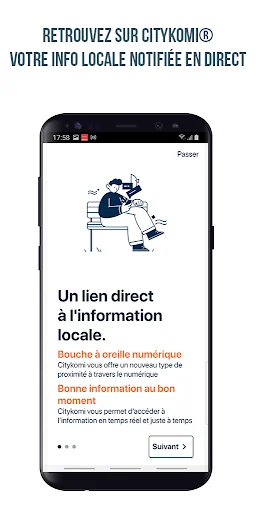
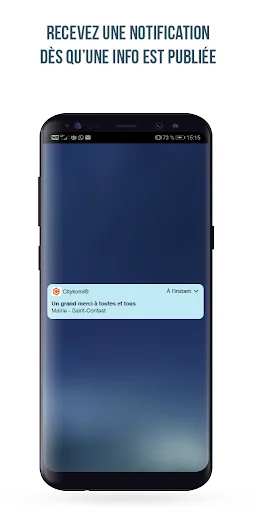
The right information at the right time
Citykomi® is the application for local authorities, services, associations and businesses that want to inform you in real time and with confidence to make your life easier. All our broadcasters are authenticated to guarantee you information from a safe, relevant and secure source.
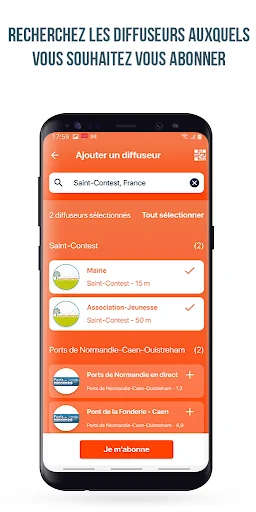
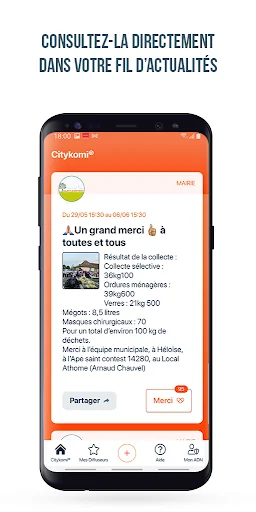
It's up to you
Download Citykomi and choose the information that interests you to feed your own news feed. You alone decide what you want to see or not see, at any time.
…
The right information at the right time
Citykomi® is the application for local authorities, services, associations and businesses that want to inform you in real time and with confidence to make your life easier. All our broadcasters are authenticated to guarantee you information from a safe, relevant and secure source.
It's up to you
Download Citykomi and choose the information that interests you to feed your own news feed. You alone decide what you want to see or not see, at any time.
Your data is none of our business
The application does not use any personal data: no phone number, no email address, no geolocation or identifier of your smartphone. Our commitment is sealed by our patent n°14 61466 obtained on 30/12/2016.
Citykomi was designed to be and stay sober
To limit its impact on your life, your smartphone and of course on the environment as much as possible, we have adopted strict criteria: no personal data, no advertising, no algorithm that filters information, no backward execution. -plan that consumes battery. A light application that remains so even after months of use.
Comparable Android apps
The five apps in Communication with the closest revenue to Citykomi. Click any to see its detail page.
Each forecast combines App Store rating, ratings count, monetisation model, pricing tier, IAP signals and ad-supported flag.
The base estimate is then multiplied by a per-category scaling factor learned from apps with founder-verified MRR.
Every number on this page comes from public APIs and bumetric's own snapshot history.
Full methodology covers input variables, accuracy bands per category and how we treat apps without comparable anchors.
See also the live data on Citykomi's tracker page for current rating, reviews and snapshot timeline.
Building something similar? Get a free AI audit with $-revenue forecasts for every recommendation.
 Nova Vida
 Unlisted - Second Phone Number
 besteye
 Cantonese Basic Phrases
 DPUMobil