Live screenshots from the Play Store, captured by our snapshot worker. Tap any image to enlarge.
Comehome is the app that connects people in real life, with more than 800 events per month and a community of over 300,000 constantly growing users.
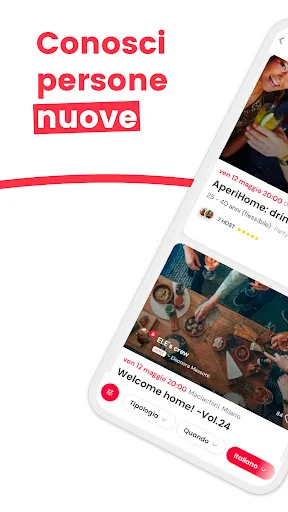
By accessing the comehome app you will find events of all kinds: live unique experiences! Nurture your interests and make new friends in your city and in other parts of the world!
You choose the type of event you want to attend:
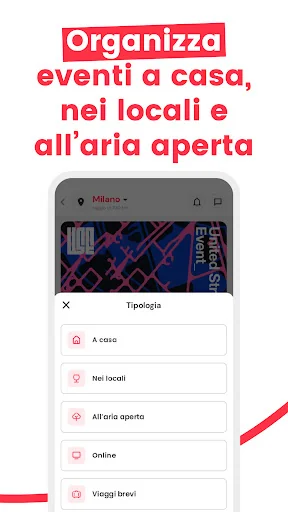
• LIVE Events: events at home and in the open air, which take place in the cities of Milan, Rome, Turin and Barce…
Read full description →
Comehome is the app that connects people in real life, with more than 800 events per month and a community of over 300,000 constantly growing users.
By accessing the comehome app you will find events of all kinds: live unique experiences! Nurture your interests and make new friends in your city and in other parts of the world!
You choose the type of event you want to attend:
• LIVE Events: events at home and in the open air, which take place in the cities of Milan, Rome, Turin and Barcelona.
• ONLINE Events: interactive video call events that you can easily and quickly access from your smartphone, tablet or PC, wherever you are.
== Join the community now! Using comehome app is easy and fun! ==
• Download the free comehome app and register in a few simple steps
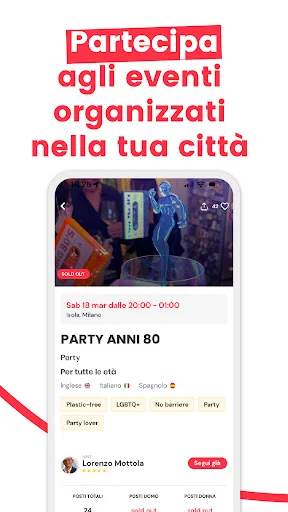
• Choose the type of event that's right for you, based on your interests and age range
• Get your pass in a few steps
• Participate and experience the comehome effect!
== HOW THE COMEHOME EXPERIENCE WORKS ==
1- Events: you decide how to participate, Online or Live, and choose the format that's right for you.
2- Filters: use them to immediately find the activities you like! Comehome events categories are: Party & Social, Sport & Wellness, Food, Art & Music, Games, Training, Talk and Special.
3- Hosts: They are the people who organize the events. You too, if you want, can propose your event and become a Host of our community.
4- Welcome: you will always feel at ease and meet people with interests similar to yours, sociable and open to making new acquaintances. In small events, it is easier to interact and make new friends!
5- Quality: the comehomers' reviews are fundamental to grant the high level of the comehome experience.
== Be part of it! -==
What are you doing tonight? Comehome events are many and for all tastes, there are no limits to our hosts’ imagination! Both Online and Live, you can find: cooking classes, live music, fitness, pilates, yoga, language lessons, board games, literary clubs, creativity, cinema, theatre, and much more.
== Reviews ==
To best choose the experience that's right for you, you can read the reviews that other comehomers have written about hosts and their past events.
== Follow the Host ==
The event you like is sold out? Do not worry! With the "Follow the Host" function, you can follow the people who organize your favourite formats. As soon as their new event is published, you will be notified by notification in the app and you will be able to get accredited before the seats are snapped up.
== Become a Host ==
Becoming a host is very easy! Create your own format, define a maximum number of participants and establish a contribution fee to access your event. If you can't wait to organize your first comehome, enter the app and access the reserved area!
== Invite friends ==
If you like comehome, also invite your friends to use the app! For each friend who participates in the first event, you will receive a 5 € credit to attend the events. Find all the info in the dedicated area.
== Comehome Values ==
In the era of social networks, our mission is to rediscover the pleasure of meeting people and sharing real life. Comehome was created to offer the opportunity to open the doors to something new, within a trust-based community, united by the values of mutual respect, friendship and real sharing.
== Facebook groups ==
Join the community by subscribing to the Facebook Groups Comehome in the languages you prefer and to the group of your city.
Join your first comehome event, we can't wait to meet you!
The five apps in Social with the closest revenue to comehome!. Click any to see its detail page.
Each forecast combines App Store rating, ratings count, monetisation model, pricing tier, IAP signals and ad-supported flag.
The base estimate is then multiplied by a per-category scaling factor learned from apps with founder-verified MRR.
Every number on this page comes from public APIs and bumetric's own snapshot history.


 Jaap Counter
 Glympse Express
 Student Tribe
 Jaga
Jaga
 Ezhava Matrimony for Malayalis