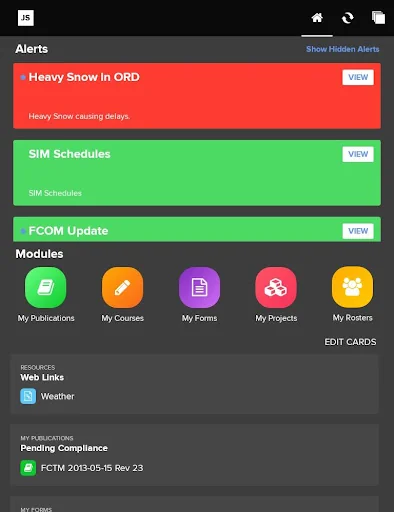
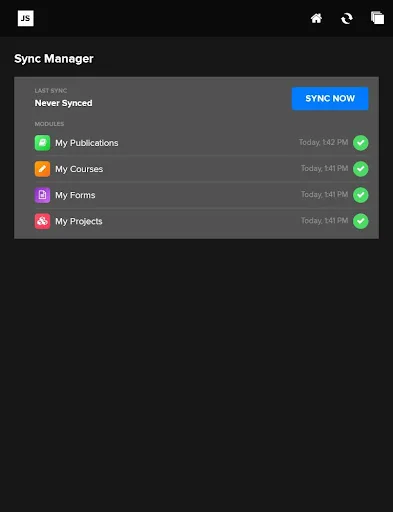
The Comply365 mobile app allows you to access communications and tasks in one place on your phone or tablet so you stay in-the-know and on-the-go, regardless of connectivity.
Comply365 has been designed to give you quick, easy access to all the information required by your company to perform your job anywhere, anytime and on any device with an Internet connection. Comply365 allows you to carry all your required publications with you, to fill out forms, to take courses and to accomplish tasks…
The Comply365 mobile app allows you to access communications and tasks in one place on your phone or tablet so you stay in-the-know and on-the-go, regardless of connectivity.
Comply365 has been designed to give you quick, easy access to all the information required by your company to perform your job anywhere, anytime and on any device with an Internet connection. Comply365 allows you to carry all your required publications with you, to fill out forms, to take courses and to accomplish tasks your company assigns to you.
Comply365 is perfect for pilots, flight attendants, maintenance, HR, customer service and more.
Comparable Android apps
The five apps in Business with the closest revenue to Comply365. Click any to see its detail page.
Each forecast combines App Store rating, ratings count, monetisation model, pricing tier, IAP signals and ad-supported flag.
The base estimate is then multiplied by a per-category scaling factor learned from apps with founder-verified MRR.
Every number on this page comes from public APIs and bumetric's own snapshot history.
Full methodology covers input variables, accuracy bands per category and how we treat apps without comparable anchors.
See also the live data on Comply365's tracker page for current rating, reviews and snapshot timeline.
Building something similar? Get a free AI audit with $-revenue forecasts for every recommendation.

 myWIKA device
 Field Service Manager
 Nordania
 Digital Waybill Quick Entry
 Manitoba Hydro