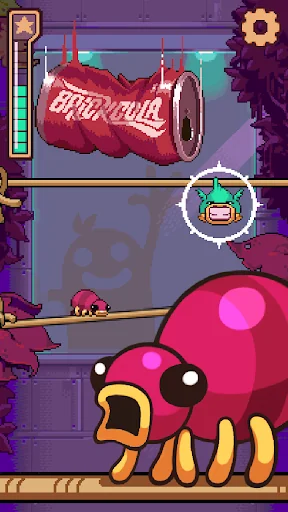
You are the latest addition in the exotic bird sanctuary. The other older birds have been Cooped Up a little too long and are a branch short of a perch! Ahhemmm... they is a bit crazy!
Fling yourself up up and away but watch out, there's more than just birds that you must avoid. However don't be afraid to snack on the way...
...and don't let the other birds laughing at you get you down! Pick yourself up and twang twang twang again!
Features:
- Intuitive twanging fling gameplay.
- Si…
You are the latest addition in the exotic bird sanctuary. The other older birds have been Cooped Up a little too long and are a branch short of a perch! Ahhemmm... they is a bit crazy!
Fling yourself up up and away but watch out, there's more than just birds that you must avoid. However don't be afraid to snack on the way...
...and don't let the other birds laughing at you get you down! Pick yourself up and twang twang twang again!
Features:
- Intuitive twanging fling gameplay.
- Simple pick up and play for all!
- Full game centre support to compete with friends and foes
- Eat worms, spiders and flies! Hmmm yummy!!!
- Boost you way up like a steam train!
Important information
This game contains third party advertising which can be removed via a one time IAP. This game contains coins which can be collected within the game for free, bought with real money or via earned via promotions. This game contains cross promotion for other Nitrome games and this is not removed with the IAP for removal of ads.
Comparable Android apps
The five apps in Arcade with the closest revenue to Cooped Up. Click any to see its detail page.
Each forecast combines App Store rating, ratings count, monetisation model, pricing tier, IAP signals and ad-supported flag.
The base estimate is then multiplied by a per-category scaling factor learned from apps with founder-verified MRR.
Every number on this page comes from public APIs and bumetric's own snapshot history.
Full methodology covers input variables, accuracy bands per category and how we treat apps without comparable anchors.
See also the live data on Cooped Up's tracker page for current rating, reviews and snapshot timeline.
Building something similar? Get a free AI audit with $-revenue forecasts for every recommendation.


 Insanus - Escape Scary House
 Slime vs. Mushroom
 Catch the Candy: Holiday Time
 SFCave
 Jump Chaos