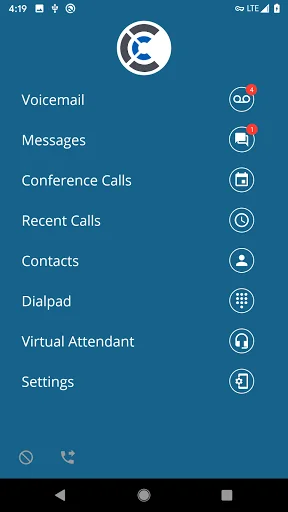
Leverage the power of your business phone through your mobile app - anywhere, anytime. By using your Android phone, you can make and receive calls from your business phone, access your voicemail, business directories, recent calls, conference bridges, virtual attendant and other valuable features.
Some key benefits of the mobile app include:
· Making calls using your business calling plan and your business caller ID
· Receiving calls made to your business phone number on the app
· Being …
Leverage the power of your business phone through your mobile app - anywhere, anytime. By using your Android phone, you can make and receive calls from your business phone, access your voicemail, business directories, recent calls, conference bridges, virtual attendant and other valuable features.
Some key benefits of the mobile app include:
· Making calls using your business calling plan and your business caller ID
· Receiving calls made to your business phone number on the app
· Being able to extension dial co-workers
· Using the shared contacts directory and having access to all extensions in the company
· Viewing recent calls
· Tapping to dial back any of your recent callers
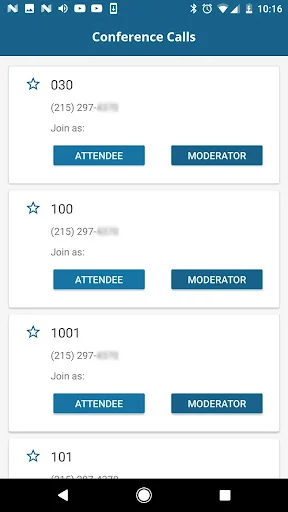
· One-tap to dial your conference bridges as a moderator or attendee
· Listening to your voicemail
· Updating your voicemail greetings
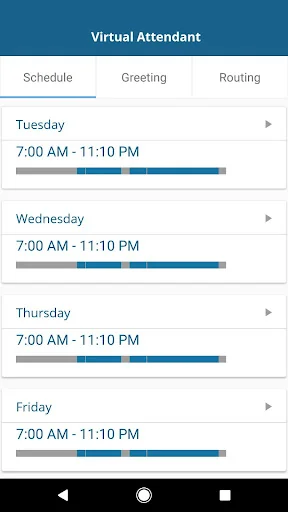
· Managing virtual attendant schedules, including the ability to override your current schedule
· Updating your virtual attendant greetings
To Use this App:
· Download and install the app on your Android phone
· Sign in using your phone system portal username and password
NOTE: If you need more information or can’t login, contact your service provider for assistance.
Comparable Android apps
The five apps in Productivity with the closest revenue to CoreNexa. Click any to see its detail page.
Each forecast combines App Store rating, ratings count, monetisation model, pricing tier, IAP signals and ad-supported flag.
The base estimate is then multiplied by a per-category scaling factor learned from apps with founder-verified MRR.
Every number on this page comes from public APIs and bumetric's own snapshot history.
Full methodology covers input variables, accuracy bands per category and how we treat apps without comparable anchors.
See also the live data on CoreNexa's tracker page for current rating, reviews and snapshot timeline.
Building something similar? Get a free AI audit with $-revenue forecasts for every recommendation.


 Smart Flip Cover Window on/off
 G1 Pro
 Calends Calendar
 Driver tickets android
 Malayalam Calendar 2024