What Cost Recipes actually does (from store listing)
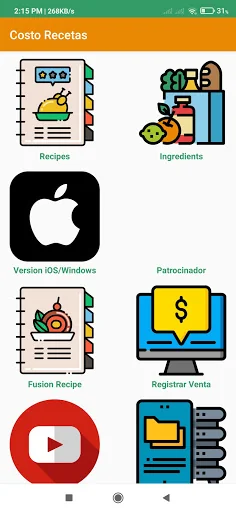
Calculate the sale value of your recipes with the Recipe Costs application. Find out how much to charge for your recipes based on the materials used.
Save time when calculating the cost of your prescriptions. This app shows the total cost and how much to sell your prescriptions. Find out how much to charge quickly!
⭐ Easy to use
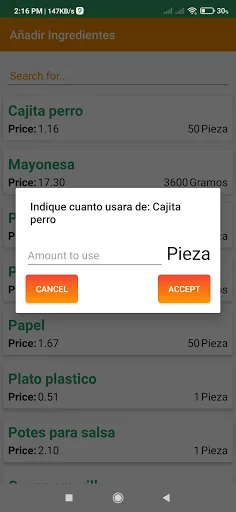
Add a new recipe. Add the ingredients. how many servings does the recipe yield and voila! The app will do the rest!
💡 Automatically updated recipes
Has ther…
Calculate the sale value of your recipes with the Recipe Costs application. Find out how much to charge for your recipes based on the materials used.
Save time when calculating the cost of your prescriptions. This app shows the total cost and how much to sell your prescriptions. Find out how much to charge quickly!
⭐ Easy to use
Add a new recipe. Add the ingredients. how many servings does the recipe yield and voila! The app will do the rest!
💡 Automatically updated recipes
Has there been any change in the price of the ingredients in the market? Just change the ingredient price and the sale price updates automatically!
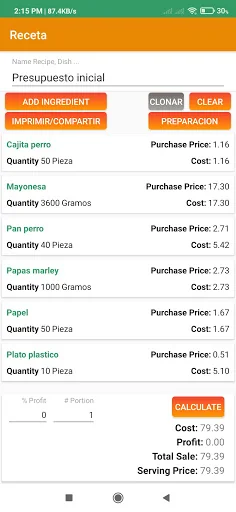
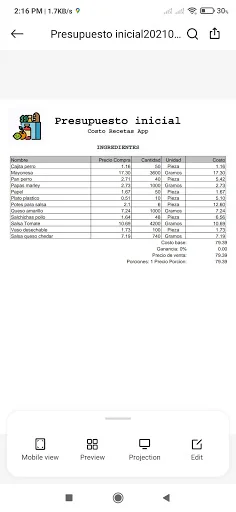
📋 Cost report
The app issues a report showing the total cost of materials and how much to sell the recipe based on the desired profit.
🔖 Sale price
How much to charge for cakes, sweets and snacks? This app will help you to know how much to sell your cake, candy or snack!
This app will help you to know how much to sell your recipes! Enjoy and download now. And feel free to share the Calculate Recipe Costs app with your friends!
Comparable Android apps
The five apps in Food & Drink with the closest revenue to Cost Recipes. Click any to see its detail page.
Each forecast combines App Store rating, ratings count, monetisation model, pricing tier, IAP signals and ad-supported flag.
The base estimate is then multiplied by a per-category scaling factor learned from apps with founder-verified MRR.
Every number on this page comes from public APIs and bumetric's own snapshot history.
Full methodology covers input variables, accuracy bands per category and how we treat apps without comparable anchors.
See also the live data on Cost Recipes's tracker page for current rating, reviews and snapshot timeline.
Building something similar? Get a free AI audit with $-revenue forecasts for every recommendation.

 Саюри доставка
 Coffea
 Burger King Qatar
 Kaba
Kaba
 TokiNY: доставка еды Минск