1.3M Assets Tracked Updated 3 min ago Revenue Forecasts
Add an app Create Account Sign In
Home
COT Classroom Observation icon

How much does COT Classroom Observation earn?

Android app from Punjab Information Technology Board · Communication

ML forecast ★ 1.0 · 356 Free

~263/mo

ML revenue forecast. Calibrated against 22864 apps in this category.

Confidence band
±15%
High — many comparable apps with verified data

At a glance

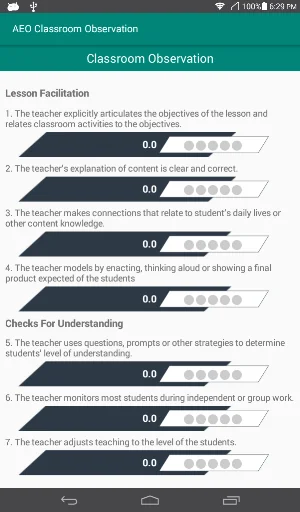
What the app looks like

Live screenshots from the Play Store, captured by our snapshot worker. Tap any image to enlarge.

COT Classroom Observation screenshot 1 COT Classroom Observation screenshot 2 COT Classroom Observation screenshot 3 COT Classroom Observation screenshot 4

COT Classroom Observation's revenue trajectory

Forecast revenue from snapshot history. Last 1 months.

Where COT Classroom Observation sits in Communication

Revenue distribution of 22864 comparable apps. COT Classroom Observation highlighted.

COT Classroom Observation vs comparable apps

Revenue trajectory side-by-side. Bold = COT Classroom Observation, ghosted = peers.

App spec

Version
3.0
Last update
Jan 22, 2024
Launched
May 20, 2014
Price
Free
Monetization
Free

What COT Classroom Observation actually does (from store listing)

COT Classroom Observation is a tablet based monitoring form developed by PITB. This is used by Officials to evaluate teachers based on different performance indicators.

Comparable Android apps

The five apps in Communication with the closest revenue to COT Classroom Observation. Click any to see its detail page.

AppRevenueRatingRatings
Learn Arabic - Speak Arabic -  icon Learn Arabic - Speak Arabic - 263 ★ 4.2 136
Evenium ConnexMe icon Evenium ConnexMe 263 ★ 3.5 171
EVO PTT: Team Walkie Talkie icon EVO PTT: Team Walkie Talkie 263 ★ 3.3 90
Alert SA icon Alert SA 263 ★ 5.0 2K
Maher Digital Directory icon Maher Digital Directory 263 0
Own COT Classroom Observation? Replace our estimate with your real revenue via Stripe Connect or ASC. Get a public Verified badge.
Claim & verify →

How we calculated this

Each forecast combines App Store rating, ratings count, monetisation model, pricing tier, IAP signals and ad-supported flag. The base estimate is then multiplied by a per-category scaling factor learned from apps with founder-verified MRR. Every number on this page comes from public APIs and bumetric's own snapshot history.

Full methodology covers input variables, accuracy bands per category and how we treat apps without comparable anchors. See also the live data on COT Classroom Observation's tracker page for current rating, reviews and snapshot timeline.

Building something similar? Get a free AI audit with $-revenue forecasts for every recommendation.
Audit my app →