Directly overlay and compare cellular carrier coverage maps! Perfect for travelers - research where you're covered across the USA (and now Canada!!)
** Follow our Facebook page to get update alerts: http://www.facebook.com/CoverageMapApp, or check our support page**
Coverage? focuses on helping mobile bandwidth junkies find cell signal as they roam. Save time looking up coverage on the carrier's websites, compare their claims head to head and better plan your travels to stay connected.
…
Directly overlay and compare cellular carrier coverage maps! Perfect for travelers - research where you're covered across the USA (and now Canada!!)
** Follow our Facebook page to get update alerts: http://www.facebook.com/CoverageMapApp, or check our support page**
Coverage? focuses on helping mobile bandwidth junkies find cell signal as they roam. Save time looking up coverage on the carrier's websites, compare their claims head to head and better plan your travels to stay connected.
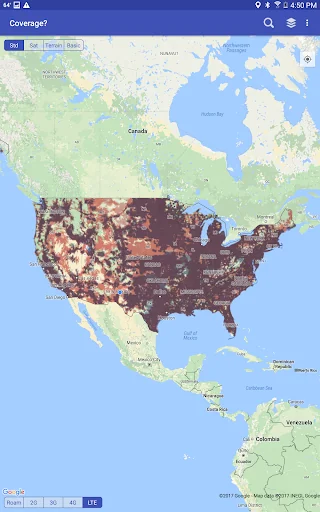
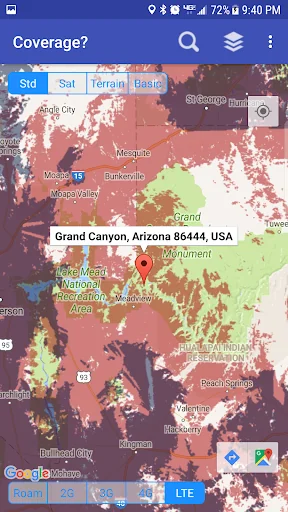
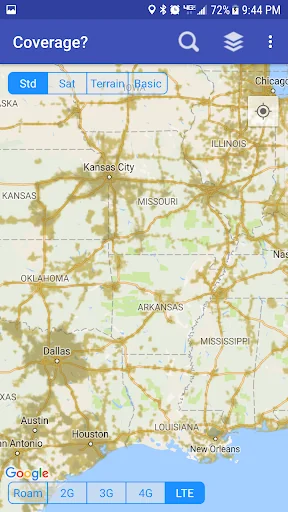
** The carrier's maps in your pocket: This app contains regional level maps based off of each major carrier's data map - as of our last update. Quickly overlay the carriers you use to create your own personalized coverage map on your device.
** No internet needed: Our proprietary compressed coverage maps are stored within the app on your device - no downloading needed! Quickly access where you're supposed to get a signal, even when you have none.
** Urban and rural areas: Maps are at a regional level, and cover the entire continental USA, Canada, Alaska, Hawaii, Puerto Rico, and the US Virgin Islands.
** Carriers included: AT&T, Verizon, T-Mobile, Dish/Boost, US Cellular.
** Canadian Carriers: Bell, Telus, Rogers (optional unlock)
** Know where to roam: view 5G, LTE, and roaming areas as overlays, focus on finding the coverage type you desire.
Check http://www.twostepsbeyond.com/apps/coverage for a quick video demo.
We created this app because we are full time 'technomads' ourselves who rely on mobile data to work remotely. Keeping this app updated is a priority for us, as we depend on it ourselves!
--------------
Coverage FAQ:
Q: Why aren't the maps more detailed or released more often?
A: Our map updates require a lot of meticulous labor intensive processing. The optional HD maps are updated quarterly.
Q: What makes 'Coverage?' unique?
A: There are great apps out there that collect user submitted signal reports - we recommend them and use them ourselves. However, those apps are only useful in markets with an active user base. We took a different approach with Coverage? - we needed a tool to at least give us an idea of where signal should be - urban, rural, and out in the boonies.
--------------
Named 'Essential Tool' by Wired Magazine
** Winner - 'Most Useful App' - iOSDevCamp
"this app can be indispensable" - Lifehacker.com
--------------
The maps in 'Coverage?' are provided in partnership with Ookla, and represent proprietary interpretations of the coverage reported by each carrier. You should not rely on the maps in Coverage to be perfectly precise or absolutely timely.
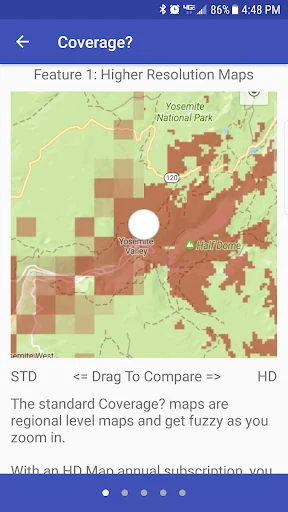
Ongoing map updates have been free - but to support the ongoing development costs, we now allow customers to subscribe to higher resolution maps that will be updated more frequently.
Coverage does not report or predict signal strength (there are great apps out there for that!). We can make no promises as to where you'll *actually* get signal.. there are too many variables - towers, device, terrain, weather, etc.
So… Got Coverage?
Additional information about The HD Maps Subscription:
This is an auto-renewable subscription, with a duration of one year.
The subscription fee will be charged to your iTunes account upon confirmation of purchase, and will automatically renew each year unless auto-renew is turned off at least 24 hours prior to the end of the current subscription period.
Current subscriptions may not be canceled during the active subscription period; however, you can manage your subscription and/or turn off auto-renewal by visiting your iTunes Account Settings after purchase.
Terms of Use and Privacy Policy: http://www.twostepsbeyond.com/privacy/
Comparable Android apps
The five apps in Maps & Navigation with the closest revenue to Coverage?. Click any to see its detail page.
Each forecast combines App Store rating, ratings count, monetisation model, pricing tier, IAP signals and ad-supported flag.
The base estimate is then multiplied by a per-category scaling factor learned from apps with founder-verified MRR.
Every number on this page comes from public APIs and Bumetric's own snapshot history.
Full methodology covers input variables, accuracy bands per category and how we treat apps without comparable anchors.
See also the live data on Coverage?'s tracker page for current rating, reviews and snapshot timeline.
Building something similar? Get a free AI audit with $-revenue forecasts for every recommendation.


 Такси Модем г. Норильск
 Montreal Subway - MonTransit
 Meridian.Cabin Crew
 國家公園登山App
 H2.LIVE – For Clean Drivers