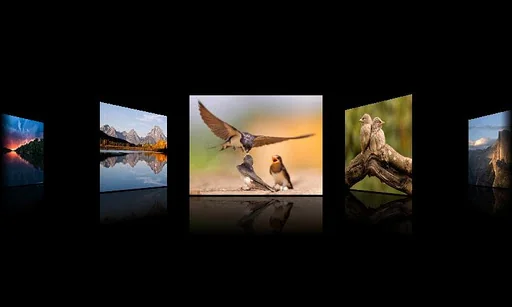
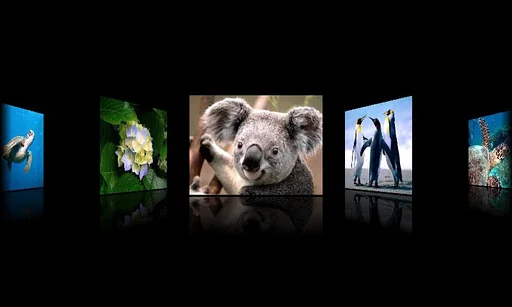
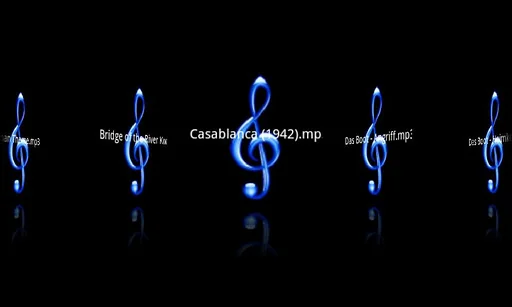
This Android program is a coverflow explorer. It allows you to browse your pictures/videos/files as a 3D gallery ipod style, generates thumbnails for pictures, movies and has specific icons for music and pdf documents.
The supported formats are for pictures : gif, bmp, jpg, tif, png; for movies : avi, wmf, mp4, mkv, wmv, m4v, mpg, flc; for music : mp3, wav & for documents : pdf (need third party program like Thinkfree) with thumbnail generator.
Please note : the thumbnails for pictures are…
This Android program is a coverflow explorer. It allows you to browse your pictures/videos/files as a 3D gallery ipod style, generates thumbnails for pictures, movies and has specific icons for music and pdf documents.
The supported formats are for pictures : gif, bmp, jpg, tif, png; for movies : avi, wmf, mp4, mkv, wmv, m4v, mpg, flc; for music : mp3, wav & for documents : pdf (need third party program like Thinkfree) with thumbnail generator.
Please note : the thumbnails for pictures are generated from cache, the cache is build from your very first browsing in the folder. You may encounter some slowness during the first generation of cache, but then, the flow is smooth.
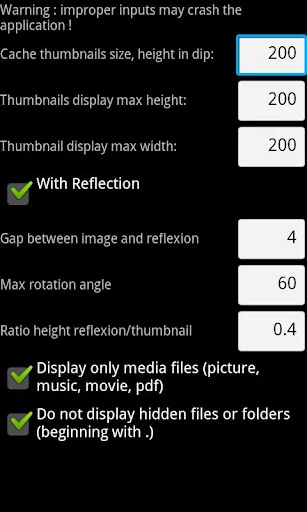
As parameters, you can set the folder you want start browsing (work like shortcut), resize the thumbnails, modify the effects (reflection, gap, rotation angle).
A Picasa tool is included to download your pictures and movies on your SD card to watch them even offline. This feature need your Google credential reading.
You can now also bowse your Picasa album online in a coverflow mode when clicking on the album cover image.
Please make CONSTRUCTIVE comment to improve the product.
About the permission requested by the application:
WRITE_EXTERNAL_STORAGE : to save video/picture/caches on the INTERNET and ACCESS_NETWORK_STATE : for Picasa API and Samba browsing.
GET_ACCOUNTS and USE_CREDENTIALS : used to allow you access your Picasa albums.
WAKE_LOCK : force the smartphone to not enter the screen saver mode during playing a video
Previous release Logs :
V1.4.1 :
-Fix crash on zoom for jpeg pictures.
V1.4 :
-Add PDF thumbnails (still beta : some PDF cannot be completely generated)
-When click on a picture, add horizontal scroll to switch prev/next picture.
-When click on the H scroll gallery, allow to drag and zoom by pinch.
- Fix crash when access to Picasa in landscape mode.
- Let you to choose the application for audio and video.
V 1.3 :
- Add Picasa online browsing,
- Release token after connection fails when log in on Picasa ("Forbidden 403 error")
- Cosmetic improvements
V 1.2 : Picasa import included, initial setup of thumbnails bigger.
V 1.1 : fix initial cache to 5 pictures
V 1.0 : initial version.
Comparable Android apps
The five apps in Video Players & Editors with the closest revenue to CoverFlow. Click any to see its detail page.
Each forecast combines App Store rating, ratings count, monetisation model, pricing tier, IAP signals and ad-supported flag.
The base estimate is then multiplied by a per-category scaling factor learned from apps with founder-verified MRR.
Every number on this page comes from public APIs and bumetric's own snapshot history.
Full methodology covers input variables, accuracy bands per category and how we treat apps without comparable anchors.
See also the live data on CoverFlow's tracker page for current rating, reviews and snapshot timeline.
Building something similar? Get a free AI audit with $-revenue forecasts for every recommendation.

 AAC Recording
 MVideo_Player
 Video Watermark Remover
 MEMORY MIC
 TV1 Kayseri