What Crashlands actually does (from store listing)
"...a design masterpiece." 5/5 - TouchArcade
2016 Game of the Year - TouchArcade, Gamezebo
2016 Action Game of the Year - Pocket Tactics
DICE 2016 Mobile Game of the Year Nominee
Time's Top 10 Games / Top 50 Apps of 2016
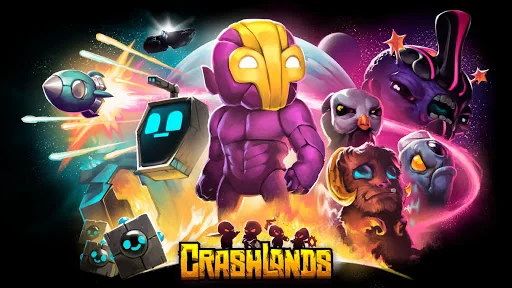
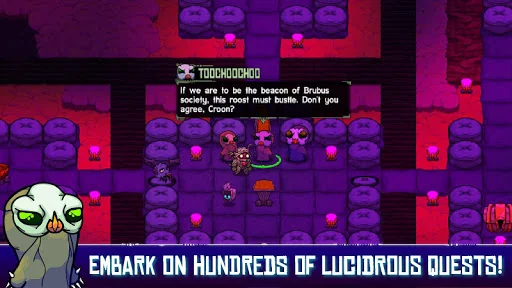
Craft, battle, and quest your way through Crashlands, an outlandish story overflowing with sass!
Become Flux Dabes, a galactic trucker whose latest shipment gets derailed by a chin-strapped alien menace named Hewgodooko, leaving you stranded on an alien planet. As you …
"...a design masterpiece." 5/5 - TouchArcade
2016 Game of the Year - TouchArcade, Gamezebo
2016 Action Game of the Year - Pocket Tactics
DICE 2016 Mobile Game of the Year Nominee
Time's Top 10 Games / Top 50 Apps of 2016
Craft, battle, and quest your way through Crashlands, an outlandish story overflowing with sass!
Become Flux Dabes, a galactic trucker whose latest shipment gets derailed by a chin-strapped alien menace named Hewgodooko, leaving you stranded on an alien planet. As you hustle to retrieve your packages you’ll become enmeshed in a nefarious plot of world domination, which will require all of your wits and both of your glutes to overcome. Learn recipes from the local sentient life, make new friends, uncover ancient secrets and deadly bosses, tame everything and build yourself a home-away-from-home as you learn to thrive on planet Woanope.
▼▼ Key Features ▼▼
● Expansive Crafting System ●
Unlock over 500 craftable items as you explore the world and learn its secrets!
● Self-managing, Infinite Inventory ●
In Crashlands, your inventory is infinite, manages itself, and retrieves your tools when you need them, so you can focus on adventuring, questing, and building. You'll never have dig through your bag or return to your base to free up inventory space!
● RPG-Style Character Progression ●
Become more powerful through creating ever-more-amazing items! As you grow in power, you can venture to new regions of the world, meet strange characters, discover new stories, and encounter new and interesting enemies.
● Skill-Based Combat ●
Learn the attacks of the enemies you encounter, and use your skill, agility, and wits to defeat them! You can even augment your fighting prowess with the power of the dozens of gadgets you can craft. Set your enemies on fire, stun them, slow down time, and more!
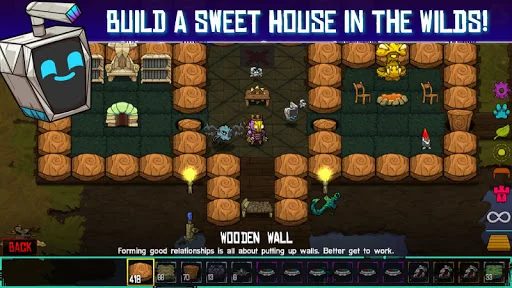
● Intuitive Base Building ●
Building a base in Crashlands is so simple it feels like fingerpainting. You can create beautiful, sprawling bases in minutes!
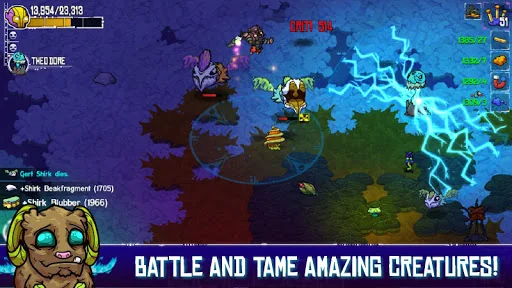
● Tameable Creatures ●
Every creature in Crashlands can become a trusty combat sidekick. Find an egg, incubate it, and hatch your very own adorable or hideous bundle of joy. You can even craft special items to grow and empower them!
● Huge World... with Huge Problems ●
Four sentient races, three continents, an epic bid for the future of the planet, and you - trapped in the middle, trying to deliver your freakin' packages. Take your time to dive into the sidestories of the characters you meet or just rush headlong into making that special delivery. With hundreds upon hundreds of quests, there's a lot to do and discover on planet Woanope!
● Effortless Cloud Saving ●
Just because your battery died or you accidentally dropped your device into a bottomless chasm, doesn't mean your save has to die with it. With BscotchID, you can easily store and retrieve your save from the cloud, and move it between your devices!
● Controller Support ●
Tired of rubbing your sweaty hands all over your beautiful touchscreen? No problem! We've got support for most mobile-compatible controllers, so you can rub your sweaty hands on some joysticks instead!
----------------------------------------
Recommended Hardware & OS:
● Android 5.0 or newer
● At least 1GB RAM
● At least 960x540px screen resolution
Please note that BscotchID functions may not work for Android 4.4 or older devices due to the outdated TLS protocol.
Comparable Android apps
The five apps in Adventure with the closest revenue to Crashlands. Click any to see its detail page.
Each forecast combines App Store rating, ratings count, monetisation model, pricing tier, IAP signals and ad-supported flag.
The base estimate is then multiplied by a per-category scaling factor learned from apps with founder-verified MRR.
Every number on this page comes from public APIs and bumetric's own snapshot history.
Full methodology covers input variables, accuracy bands per category and how we treat apps without comparable anchors.
See also the live data on Crashlands's tracker page for current rating, reviews and snapshot timeline.
Building something similar? Get a free AI audit with $-revenue forecasts for every recommendation.
 TL Pro
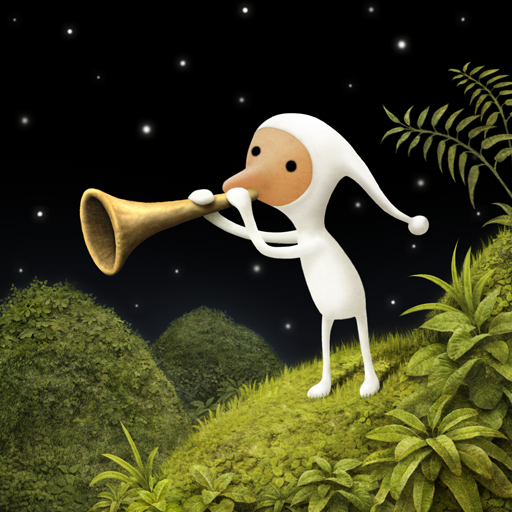 Samorost 3
 60 Seconds! Atomic Adventure
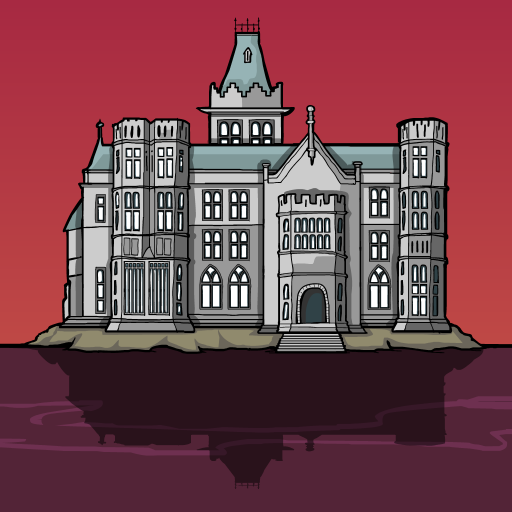 Rusty Lake Hotel
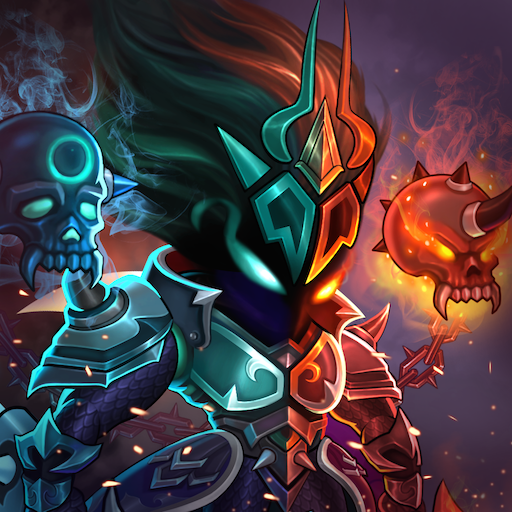 EHW Premium & stick fight