Do you love match 3 games? Do you want to create unique recipes fast and have a blast while doing so? Crazy Jam offers you an unlimited set of entertainment options and you will be more than impressed with the unique experience shared here.
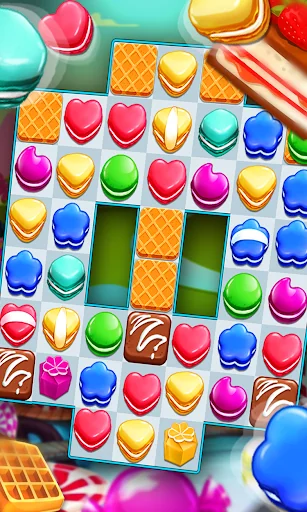
All you have to do is to match 3 or more macarons in the game and that’s it. The more you match, the better the score you can get. You will usually have to acquire a specific score, so try to keep that in mind.
There’s also a moves limit, so you should co…
Do you love match 3 games? Do you want to create unique recipes fast and have a blast while doing so? Crazy Jam offers you an unlimited set of entertainment options and you will be more than impressed with the unique experience shared here.
All you have to do is to match 3 or more macarons in the game and that’s it. The more you match, the better the score you can get. You will usually have to acquire a specific score, so try to keep that in mind.
There’s also a moves limit, so you should consider that when you try to complete the experience. There’s a lot of fun to be had as you play and each experience will be very rewarding and exciting!
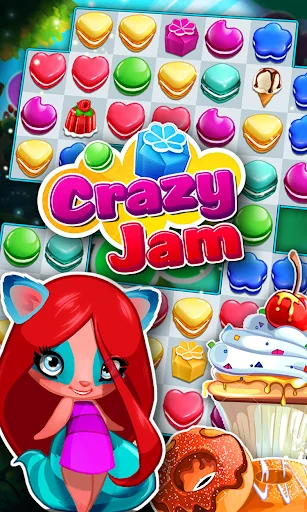
Each time you play, you will be able to encounter new challenges and tons of cool levels that you can explore. There are plenty of options, all you have to do is to give Crazy Jam a shot as soon as you can. The ingredients are ice blocks, macaroons and many others. You will have to connect as many of these as possible within the specified moves limit.
You need to help the raccoon complete all recipes as fast as possible in order to keep the customers happy. With tons of immersive levels, constant updates and stunning visuals, Crazy Jam offers you a wide array of options that you can focus on. The game also has Facebook integration, which is a recommended feature because it allows you to save levels in your account and share scores with friends! Like Shadowmatic combines stunning visuals with relaxing and captivating gameplay but not so strange.
All you need is to download Crazy Jam right now and give it a shot, you will definitely be impressed with it and its unique gameplay!
Features:
• Dozens of levels to play though
• Help the raccoon complete recipes
• Beautiful graphics
• Easy to play, hard to master
• Facebook integration - progress of your friends on the map
Comparable Android apps
The five apps in Puzzle with the closest revenue to Crazy Jam. Click any to see its detail page.
Each forecast combines App Store rating, ratings count, monetisation model, pricing tier, IAP signals and ad-supported flag.
The base estimate is then multiplied by a per-category scaling factor learned from apps with founder-verified MRR.
Every number on this page comes from public APIs and bumetric's own snapshot history.
Full methodology covers input variables, accuracy bands per category and how we treat apps without comparable anchors.
See also the live data on Crazy Jam's tracker page for current rating, reviews and snapshot timeline.
Building something similar? Get a free AI audit with $-revenue forecasts for every recommendation.


 Escape Room Game - Secret
 Spot Beauty Differences Puzzle
 HmyzoLab
 Futoshiki
 Tebak Gambar Kemerdekaan