What Crossroads actually does (from store listing)
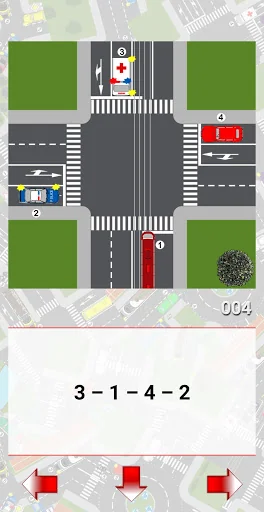
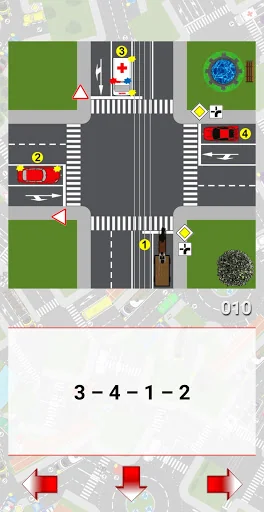
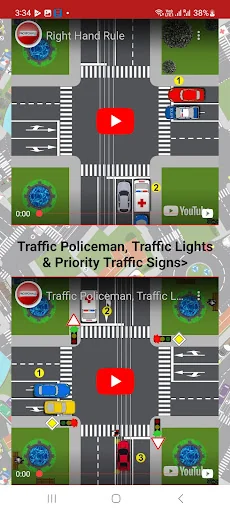
🚦 <b>Crossroads<b> 🚦 contains over 216 different traffic situations. It is ideal for preparing driving exam and school tests. Either you have driving licence or getting ready to have one, it is good to remind and test yourself.
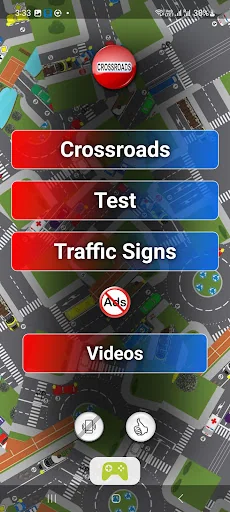
App is made as some kind of test, where you can chose desired number of intersections. Working on the one crossroad is limited to 45 seconds. Your can track your progress on Google Play Games and compare result with others.
The application is linked with our other a…
🚦 Crossroads 🚦 contains over 216 different traffic situations. It is ideal for preparing driving exam and school tests. Either you have driving licence or getting ready to have one, it is good to remind and test yourself.
App is made as some kind of test, where you can chose desired number of intersections. Working on the one crossroad is limited to 45 seconds. Your can track your progress on Google Play Games and compare result with others.
The application is linked with our other app, where you can learn traffic signs from 85 countries/regions worldwide.
NEW# 112 Video Traffic Situations
Comparable Android apps
The five apps in Education with the closest revenue to Crossroads. Click any to see its detail page.
Each forecast combines App Store rating, ratings count, monetisation model, pricing tier, IAP signals and ad-supported flag.
The base estimate is then multiplied by a per-category scaling factor learned from apps with founder-verified MRR.
Every number on this page comes from public APIs and bumetric's own snapshot history.
Full methodology covers input variables, accuracy bands per category and how we treat apps without comparable anchors.
See also the live data on Crossroads's tracker page for current rating, reviews and snapshot timeline.
Building something similar? Get a free AI audit with $-revenue forecasts for every recommendation.
 Arabic - German
 How To Play Clarinet
 Tadpoles Parents
 Agripoint jet institute
 Learn Finnish