D&R application has been updated and a world of innovation has arrived!
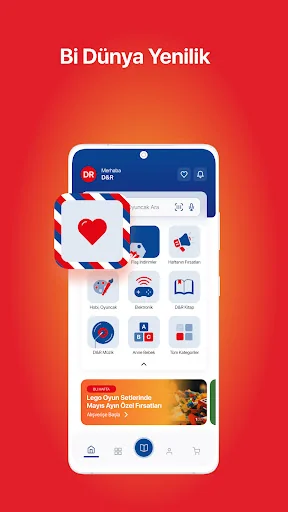
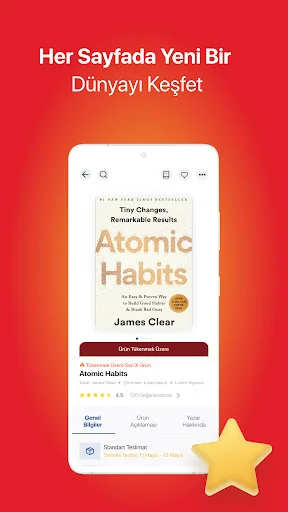
We take the shopping experience one step further with our D&R mobile application specially designed for book, music and movie enthusiasts!
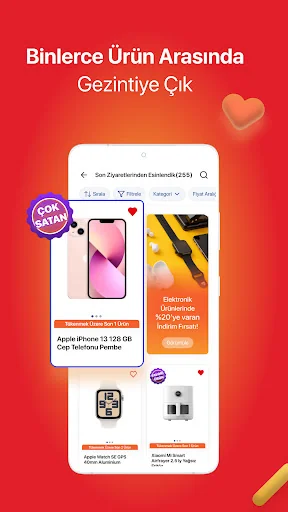
🚀 Quick Search and Filter: Instantly find the products you are looking for! Easily find the product you want thanks to quick search and advanced filtering features.
📚 Personalized Recommendations: Your discovery journey is now more special with personalized recommendations selected …
D&R application has been updated and a world of innovation has arrived!
We take the shopping experience one step further with our D&R mobile application specially designed for book, music and movie enthusiasts!
🚀 Quick Search and Filter: Instantly find the products you are looking for! Easily find the product you want thanks to quick search and advanced filtering features.
📚 Personalized Recommendations: Your discovery journey is now more special with personalized recommendations selected for you.
🔔 Instant Notifications: Get instant notifications about deals, campaigns and discounts you won't want to miss. Don't miss the latest news.
📈 Discount and Campaign Tracking: Don't miss limited-time discounts and category-specific campaigns within the application. Manage your budget in a friendly manner with constantly updated opportunities.
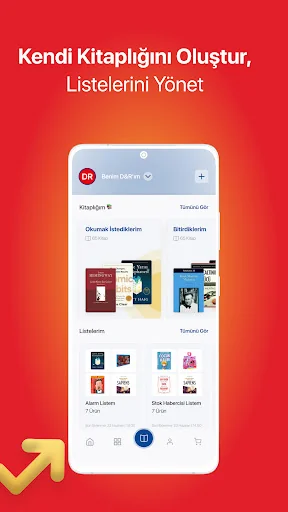
❤️ My D&R: Create your own reading lists and check them out whenever you want. Organize your reading habits by managing your personal book archive.
💼 Favorite List: Add your favorite products to the Favorite List, browse and buy now whenever you want.
💰 Price Alert: Be immediately informed of price changes on the products you specify. Don't miss the products that drop to your desired price level with the price alert.
📦 Stock Reporter List: Keep track of products that are about to run out. With the Stock Reporter, you will be instantly notified when the products you want are back in stock.
🎁 Gift Cards: Send gift cards and e-Book gift cards to your loved ones on special occasions.
💳 Secure Payment Options: Complete your shopping more easily with secure payment options. Credit card, shopping credit and constantly added payment alternatives are waiting for you.
Install the D&R mobile application now and join the World of Culture, Art and Entertainment!
Comparable Android apps
The five apps in Shopping with the closest revenue to D&R. Click any to see its detail page.
Each forecast combines App Store rating, ratings count, monetisation model, pricing tier, IAP signals and ad-supported flag.
The base estimate is then multiplied by a per-category scaling factor learned from apps with founder-verified MRR.
Every number on this page comes from public APIs and Bumetric's own snapshot history.
Full methodology covers input variables, accuracy bands per category and how we treat apps without comparable anchors.
See also the live data on D&R's tracker page for current rating, reviews and snapshot timeline.
Building something similar? Get a free AI audit with $-revenue forecasts for every recommendation.


 LINE購物 - 比價找優惠、追蹤歷史價格
 17Life 生活電商
 Wehkamp - Shop online
 Locanto - Classifieds App
 Organizy Grocery Shopping List