What Daily Camera actually does (from store listing)
To continue enjoying our app, we kindly request that you log in again after this update.
If you're a subscriber, please take a moment to restore your account to ensure uninterrupted access. You can find the “Restore Subscriptions“ button in Settings under Subscriptions.
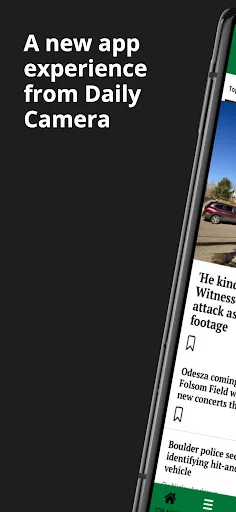
Welcome to a new app experience, we have optimized our app and given it a facelift! This faster native app now has the following new features:
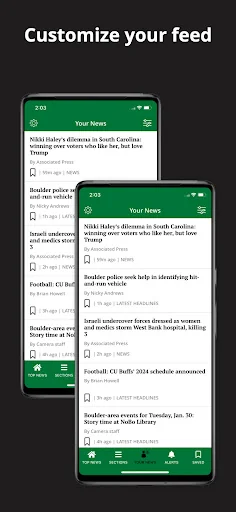
Your News:
Provide personalized recommendations for content based on user pr…
To continue enjoying our app, we kindly request that you log in again after this update.
If you're a subscriber, please take a moment to restore your account to ensure uninterrupted access. You can find the “Restore Subscriptions“ button in Settings under Subscriptions.
Welcome to a new app experience, we have optimized our app and given it a facelift! This faster native app now has the following new features:
Your News:
Provide personalized recommendations for content based on user preferences. Users will be allowed to customize the content they want to engage with by selecting the topics they are truly interested in. By going to the “Your News” tab the user can bypass the noise of all that is published and home in on the content they want
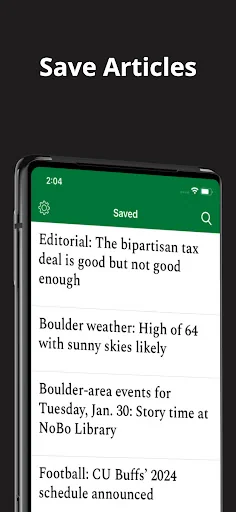
Saved Articles:
Save feature that allows users to save articles or other content they are interested in for later reading or reference.Push notifications will remind users to read their saved articles or suggest related content
Custom Push Notifications:
The user can select what topics they want to be notified about which makes for a much less intrusive experience.
Top Navigation Bar:
A top navigation bar lets the user switch between sections by swiping or tapping.
Enews in-app:
Desire the newspaper experience? No need to open a separate app! By simply going to Settings and selecting E-News the user can browse the Digital Replica of the day’s paper.
Offline Reading:
This feature allows users to enable offline reading from Settings. Offline “Reading Preferences” can also be customized for Settings.
Swipe Left:
Instead of going back to the main section to find more articles, users have the option to simply swipe, immediately opening other articles in the Section.
Follow Topics:
A user will be shown articles on topics they are following. To follow select “follow” at the article level and related articles will gain relevancy and be shown more frequently. Just as easily “Unfollow”
Terms of Use:
https://www.medianewsgroup.com/terms-of-use/
Comparable Android apps
The five apps in News & Magazines with the closest revenue to Daily Camera. Click any to see its detail page.
Each forecast combines App Store rating, ratings count, monetisation model, pricing tier, IAP signals and ad-supported flag.
The base estimate is then multiplied by a per-category scaling factor learned from apps with founder-verified MRR.
Every number on this page comes from public APIs and bumetric's own snapshot history.
Full methodology covers input variables, accuracy bands per category and how we treat apps without comparable anchors.
See also the live data on Daily Camera's tracker page for current rating, reviews and snapshot timeline.
Building something similar? Get a free AI audit with $-revenue forecasts for every recommendation.


 Lapin Kansa
 Polygon Gaming Explorer
 KQ2 News
 WDTV 5 News
 HEIDELBERG24