What DailyObjects actually does (from store listing)
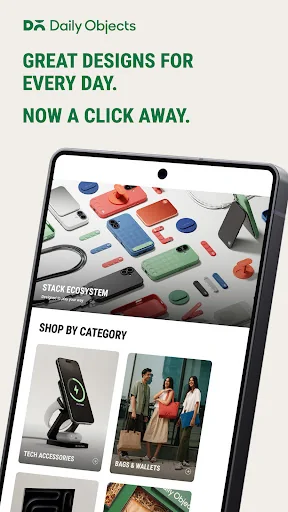
Elevate your everyday with DailyObjects, India’s go-to brand for designer phone cases, laptop sleeves, watch bands, wallets, backpacks, chargers, and more.
Why download the app?
• Shop top-tier tech, mobile covers, designer goods, and personal accessories.
• Shop designer collaborations and standout pieces, crafted by artists.
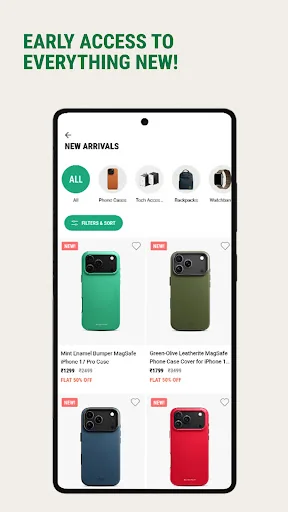
• Early access to new launches and exclusive drops.
• Enjoy a personalised in-app experience every time you log in.
• Get smooth, fast checkout & easy…
Elevate your everyday with DailyObjects, India’s go-to brand for designer phone cases, laptop sleeves, watch bands, wallets, backpacks, chargers, and more.
Why download the app?
• Shop top-tier tech, mobile covers, designer goods, and personal accessories.
• Shop designer collaborations and standout pieces, crafted by artists.
• Early access to new launches and exclusive drops.
• Enjoy a personalised in-app experience every time you log in.
• Get smooth, fast checkout & easy returns.
Featured Categories
Phone cases & covers. Custom phone cases. Designer phone covers. iPhone cases
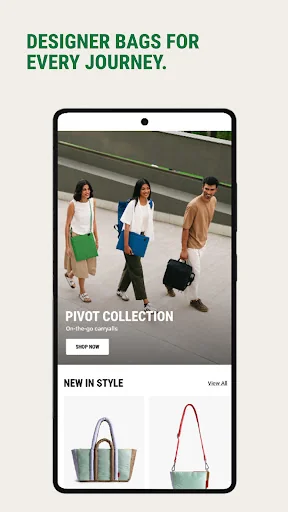
Laptop sleeves & bags. Backpacks. Wallets. Travel organizers
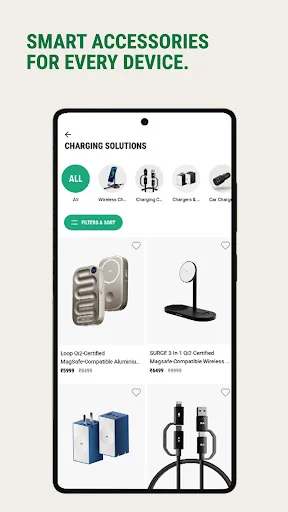
Wireless chargers & tech accessories. Apple Watch & smartwatch bands.
Phone grips, stands & more personal accessories
Perfect for your home, office, or on-the-go essentials, DailyObjects brings style and function to your everyday life. .
Download & explore.
Comparable Android apps
The five apps in Shopping with the closest revenue to DailyObjects. Click any to see its detail page.
Each forecast combines App Store rating, ratings count, monetisation model, pricing tier, IAP signals and ad-supported flag.
The base estimate is then multiplied by a per-category scaling factor learned from apps with founder-verified MRR.
Every number on this page comes from public APIs and bumetric's own snapshot history.
Full methodology covers input variables, accuracy bands per category and how we treat apps without comparable anchors.
See also the live data on DailyObjects's tracker page for current rating, reviews and snapshot timeline.
Building something similar? Get a free AI audit with $-revenue forecasts for every recommendation.

 Joyn
Joyn
 China Online Shopping App
 Jumbo
Jumbo
 우체국쇼핑
우체국쇼핑
 IKEA Saudi Arabia