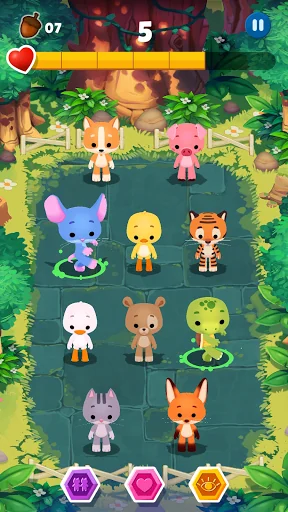
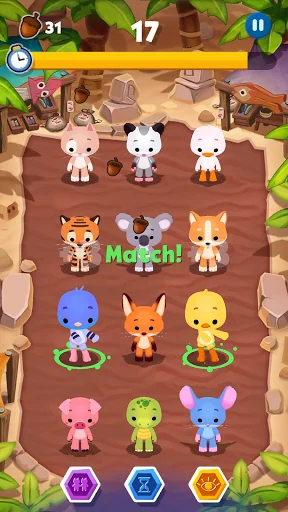
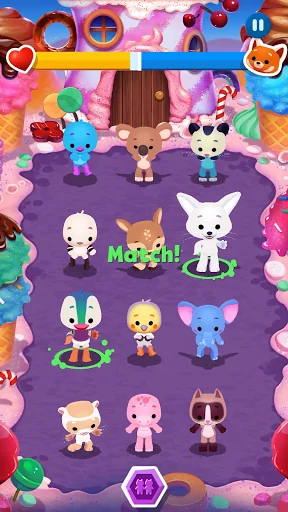
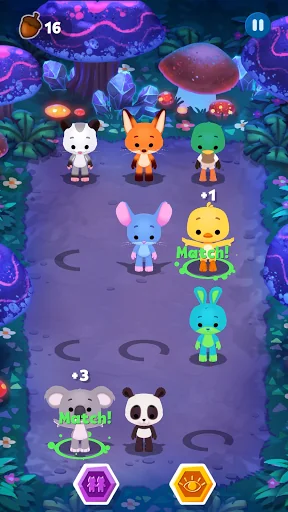
Match the pairs of animals performing the same Dance Moves! Dance your way into unlocking new Worlds, Characters, Dance Cards and more!
Features:
• Quest Mode to unlock all kinds of prices throughout different challenges!
• Casual Modes like Quick Game, Arcade and VS Mode.
• Create your own Team Lineup with your favourite animals.
• 22 Animals.
• 24 Dance Cards.
• 88 Skins.
• 6 Worlds.
Me and the entire team built this game for over 11 months, if you like it we’d really appreciate…
Match the pairs of animals performing the same Dance Moves! Dance your way into unlocking new Worlds, Characters, Dance Cards and more!
Features:
• Quest Mode to unlock all kinds of prices throughout different challenges!
• Casual Modes like Quick Game, Arcade and VS Mode.
• Create your own Team Lineup with your favourite animals.
• 22 Animals.
• 24 Dance Cards.
• 88 Skins.
• 6 Worlds.
Me and the entire team built this game for over 11 months, if you like it we’d really appreciate a good review and if you have any comments or suggestions we’d love to hear them!
Dave XP
_____________________________________________
Follow me on:
TikTok: https://vm.tiktok.com/ZMeR2hQW1/
Instagram: https://www.instagram.com/dave.xp/
This app allows you to purchase virtual items within the app and may contain third-party advertisements that may redirect you to a third-party site.
Each forecast combines App Store rating, ratings count, monetisation model, pricing tier, IAP signals and ad-supported flag.
The base estimate is then multiplied by a per-category scaling factor learned from apps with founder-verified MRR.
Every number on this page comes from public APIs and bumetric's own snapshot history.
Full methodology covers input variables, accuracy bands per category and how we treat apps without comparable anchors.
See also the live data on Dance Jam's tracker page for current rating, reviews and snapshot timeline.
Building something similar? Get a free AI audit with $-revenue forecasts for every recommendation.
 아이오 프린세스
 Alabama Bones
 Yakiniku King
 Save The Crew
 Push One Beer! 3D Game