ML revenue forecast.
Calibrated against 35236 apps in this category.
Confidence band
±15%
High — many comparable apps with verified data
At a glance
Earns 1.76× more than the category median (151/mo).
Ranks #8,025 of 35,236 in Productivity (top 22.8% by revenue).
Launched Nov 22, 2012 · last updated May 03, 2026.
What the app looks like
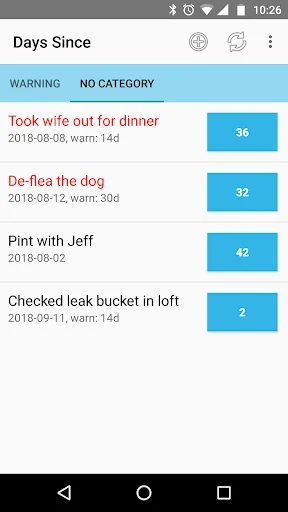
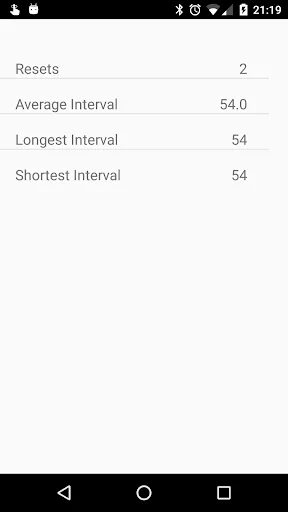
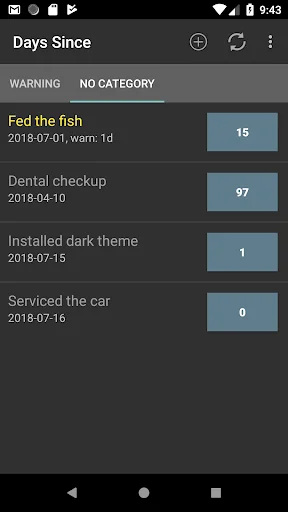
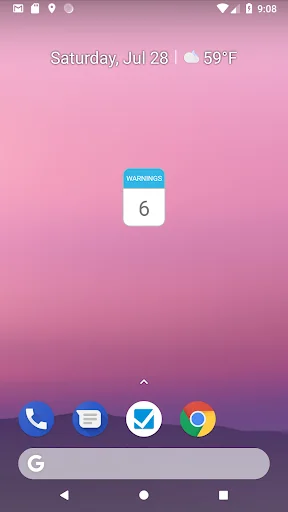
Live screenshots from the Play Store, captured by our snapshot worker. Tap any image to enlarge.
Days Since's revenue trajectory
Forecast revenue from snapshot history. Last 1 months.
Where Days Since sits in Productivity
Revenue distribution of 35236 comparable apps. Days Since highlighted.
Days Since vs comparable apps
Revenue trajectory side-by-side. Bold = Days Since, ghosted = peers.
App spec
Version
2.11.0
Last update
May 03, 2026
Launched
Nov 22, 2012
Price
Free
Monetization
Free
What Days Since actually does (from store listing)
DaysSince keeps a track of when you last did an event using your phones Calendar to store the events. Add an event, add a warning time, and it will remind you about it. The simple interface shows you a list of all the events and the number of days since you last did them. Each time you do the event just hit the reset button and you’ll always know when you last did it! All this and it will synchronise across all devices and backup to the cloud; without an advert in site.
Do you have a terrible…
DaysSince keeps a track of when you last did an event using your phones Calendar to store the events. Add an event, add a warning time, and it will remind you about it. The simple interface shows you a list of all the events and the number of days since you last did them. Each time you do the event just hit the reset button and you’ll always know when you last did it! All this and it will synchronise across all devices and backup to the cloud; without an advert in site.
Do you have a terrible memory? Have trouble Getting Things Done? Can’t remember the last time you de-fleaed the cat? Or met up with a long distance mate? When did you last have the oil changed in the car?
Don't use your brain to remember when you last did something! Use that for more useful things like creating cool new music, or really hard maths. Use DaysSince to remind you of all the boring stuff!
DaysSince Features: -
Synchronised events. DaysSince uses your phones calendar to store the event data, meaning it’s always synchronised across all your devices. Hit reset on your phone, and your tablet will reflect the current data.
Notifications. Setup a warning time for each event. The notifications will remind you (but not too much) that you have events which have reached their limits.
Simple easy to use interface. Click add to add, click the reset button (the blue one with the number of days on it) to reset. Couldn't be simpler.
Statistics. It keeps a track of the past resets and gives you a basic breakdown of data. Number of resets, shortest, longest and average.
Multiple calendars. DaysSince can use any accessible writeable phone calendar, with your permission. You can create multiple calendars just for DaysSince and switch between them. To achieve this - create a new calendar through your phones calendar app and you will be able to choose it (once synchronised) on your device.
Categories. Keep your events grouped for easier management, and all your warnings in one place.
Dark theme. For night time productivity.
Import events from another calendar. So you can switch over to a dedicated DaysSince calendar.
Widget. Keep your warnings data front and centre.
Offline Storage mode for those who don't want to use a Google Calendar. Keep data just on your phone. Featuring back up and restore functionality, so offline storage can be moved over to a new phone.
Comparable Android apps
The five apps in Productivity with the closest revenue to Days Since. Click any to see its detail page.
Each forecast combines App Store rating, ratings count, monetisation model, pricing tier, IAP signals and ad-supported flag.
The base estimate is then multiplied by a per-category scaling factor learned from apps with founder-verified MRR.
Every number on this page comes from public APIs and bumetric's own snapshot history.
Full methodology covers input variables, accuracy bands per category and how we treat apps without comparable anchors.
See also the live data on Days Since's tracker page for current rating, reviews and snapshot timeline.
Building something similar? Get a free AI audit with $-revenue forecasts for every recommendation.


 My Step Calculator
 PestPac Mobile (version 3)
 Geogestión Horaria
 Alerta Licitação
 WorkWave Route Manager