What DD Toolbox actually does (from store listing)
The DD Toolbox includes useful tools for setting up and analyzing high performance car audio systems. We understand installers have a lot going on while setting up a system, so the DD Toolbox layout was designed with this in mind. A DD Toolbox feature is the ability to easily switch between tools, allowing fast and convenient use of the multiple tools. This allows you to do things like use the tone generator while punching numbers into the power calculator!
DD Toolbox features:
-Power / …
The DD Toolbox includes useful tools for setting up and analyzing high performance car audio systems. We understand installers have a lot going on while setting up a system, so the DD Toolbox layout was designed with this in mind. A DD Toolbox feature is the ability to easily switch between tools, allowing fast and convenient use of the multiple tools. This allows you to do things like use the tone generator while punching numbers into the power calculator!
DD Toolbox features:
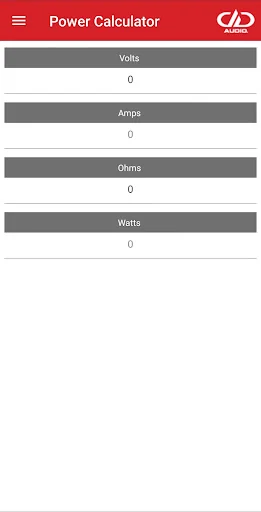
-Power / Ohm's Law Calculator for determining your systems actual output wattage and impedance
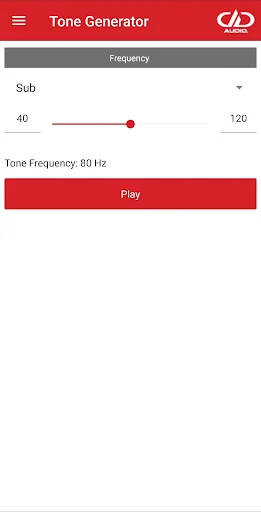
-Tone Generator
-DD Box calculator which uses DD's exclusive enclosure design theory to make a recommendation for maximum bass in your given enclosure space
Connectivity Note: DD Toolbox requires connectivity in order to download dynamic configuration data (allows us to add new speakers/specs to the calculator for example, without having to create a new build). If you attempt to run it without connectivity you may receive an error.
Language Note: This version is capable of handling the native language of your device, but we have to provide a language file for it to use. If you're willing to help with translation to your language, please let us know, we'd love to make more languages generally available.
Comparable Android apps
The five apps in Tools with the closest revenue to DD Toolbox. Click any to see its detail page.
Each forecast combines App Store rating, ratings count, monetisation model, pricing tier, IAP signals and ad-supported flag.
The base estimate is then multiplied by a per-category scaling factor learned from apps with founder-verified MRR.
Every number on this page comes from public APIs and bumetric's own snapshot history.
Full methodology covers input variables, accuracy bands per category and how we treat apps without comparable anchors.
See also the live data on DD Toolbox's tracker page for current rating, reviews and snapshot timeline.
Building something similar? Get a free AI audit with $-revenue forecasts for every recommendation.



 Lithuanian for AnySoftKeyboard
 System Monitor
 Piping Fabrication and Welding
 SSTP Max
 Photo Recovery: Video Recovery