Android app
from Dead Stock Sneakerblog
· Lifestyle
ML forecast★ 3.4 · 919Free
~495/mo
ML revenue forecast.
Calibrated against 51929 apps in this category.
Confidence band
±15%
High — many comparable apps with verified data
At a glance
Earns 2.94× more than the category median (168/mo).
Ranks #5,132 of 51,929 in Lifestyle (top 9.9% by revenue).
Launched Sep 19, 2019 · last updated Aug 09, 2024.
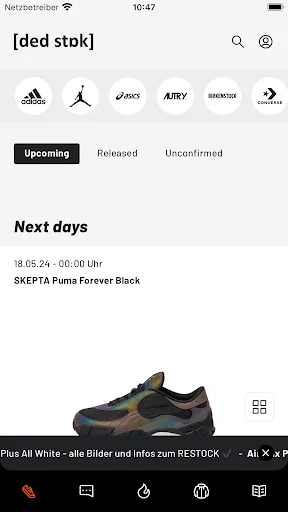
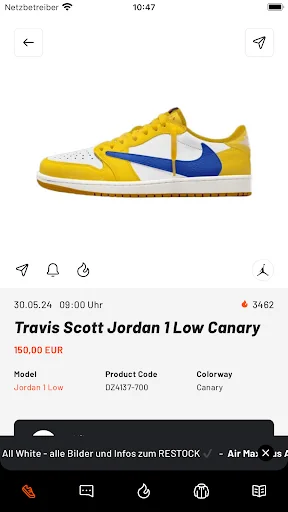
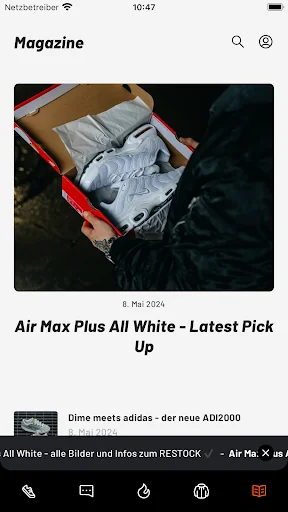
What the app looks like
Live screenshots from the Play Store, captured by our snapshot worker. Tap any image to enlarge.
Dead Stock's revenue trajectory
Forecast revenue from snapshot history. Last 1 months.
Where Dead Stock sits in Lifestyle
Revenue distribution of 51929 comparable apps. Dead Stock highlighted.
Dead Stock vs comparable apps
Revenue trajectory side-by-side. Bold = Dead Stock, ghosted = peers.
App spec
Version
2.7.4
Last update
Aug 09, 2024
Launched
Sep 19, 2019
Price
Free
Monetization
Free
What Dead Stock actually does (from store listing)
DEAD STOCK - THE APP With the large number of hyped sneaker releases, it's not always easy to keep track.
The Dead Stock app helps you stay up to date with the latest in streetwear and sneakers and ensures you never miss a limited drop or restock. You get all the information you need directly on your smartphone - and it's absolutely free!
By turning on push notifications, you will be constantly informed about limited releases, restocks and current news. In the event of a drop, the push t…
DEAD STOCK - THE APP With the large number of hyped sneaker releases, it's not always easy to keep track.
The Dead Stock app helps you stay up to date with the latest in streetwear and sneakers and ensures you never miss a limited drop or restock. You get all the information you need directly on your smartphone - and it's absolutely free!
By turning on push notifications, you will be constantly informed about limited releases, restocks and current news. In the event of a drop, the push takes you straight to the store, preventing your valuable time from being lost. Of course, you can also mark your favorite sneakers as favorites and have reminders sent to you independently. Give it a try!
Otherwise, you can be inspired by high-quality editorials on the blog within the app. When browsing through the releases you will find all the shops and competitions for the respective sneaker. Are you looking for a cheap sneaker and don't want to spend a lot of money? No problem, there is our sales category where you can find current deals every day.
- Release calendar:
All current sneakers are conveniently available at a glance
- Favorites list
save your favorite sneakers in your personal favorites push notifications
daily news, releases and restocks directly to your smartphone blog:
current blog articles from the sneaker & streetwear world
- Sale: constantly new deals and promotions from current brands
Comparable Android apps
The five apps in Lifestyle with the closest revenue to Dead Stock. Click any to see its detail page.
Each forecast combines App Store rating, ratings count, monetisation model, pricing tier, IAP signals and ad-supported flag.
The base estimate is then multiplied by a per-category scaling factor learned from apps with founder-verified MRR.
Every number on this page comes from public APIs and bumetric's own snapshot history.
Full methodology covers input variables, accuracy bands per category and how we treat apps without comparable anchors.
See also the live data on Dead Stock's tracker page for current rating, reviews and snapshot timeline.
Building something similar? Get a free AI audit with $-revenue forecasts for every recommendation.


 AEON VietNam
 PDF Viewer
 ตรวจหวย QRCode
 REDMOND Robot
 Circle Parental Controls App